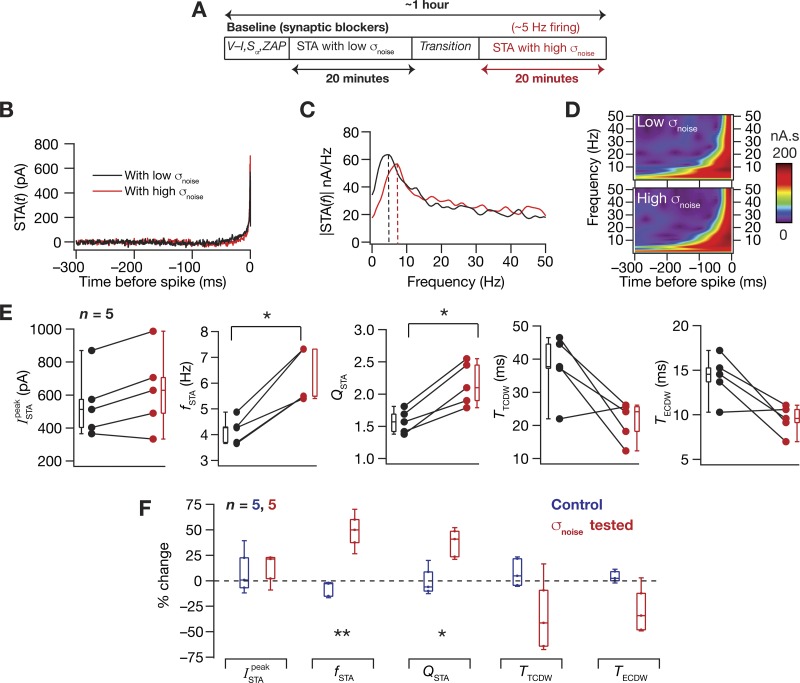
Fig. 4.
Hippocampal STA was dependent on the input statistics. A: the experimental protocol for measuring the dependency of STA on input statistics by measuring STA with GWN of two different σnoise values. B and C: the STA (B) and its Fourier (C) and wavelet (D) transform magnitudes measured in the same cell at resting membrane potentials with two different values of σnoise, the standard deviation of the GWN. D: significant effect (Wilcoxon signed-rank sum test, *P < 0.05, n = 5) of altering membrane potential was seen on fSTA and QSTA. For these panels, black and red represent measurements with low (adjusted to obtain ~1-Hz average firing rate) and high (adjusted to obtain ~5-Hz average firing rate) σnoise, respectively. F: percent changes in all of the STA measurements (red, σnoise tested) obtained on altering the σnoise are plotted showing the variable impact of altering σnoise on each measurement. Comparisons with control experiments (blue, control) are shown, which involved measuring the STA twice, with a temporal separation similar to the other experiments, at the same voltage (RMP) and with the same GWN (Mann-Whitney U-test, *P < 0.05, **P < 0.01).

