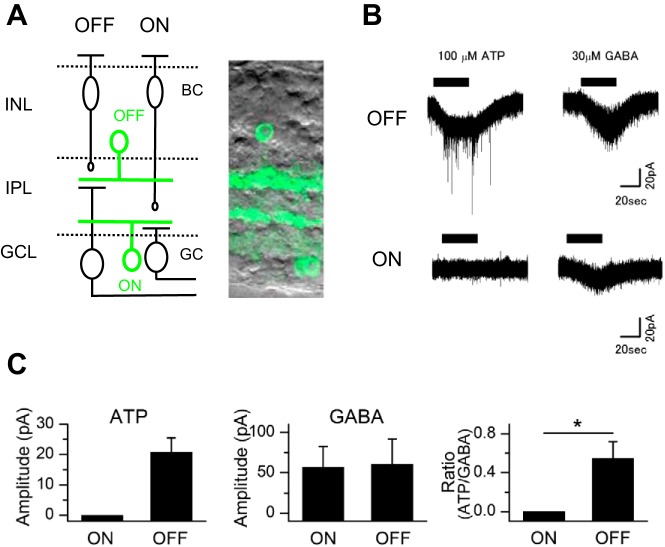
Fig. 1.
Recordings of ATP-induced choline currents. A: schematic drawings (left) of the mouse retina and photomicrographs (right) showing GFP-positive cholinergic amacrine cells (CAs) in slice preparations. The ON and OFF pathways are indicated at the top of the schema. ON- and OFF-CAs are labeled as ON (green) and OFF (green). Somas of OFF-CAs are located in the inner nuclear layer, whereas somas of ON-CAs are located in the ganglion cell layer. BC, bipolar cell; GC, ganglion cell; INL, inner nuclear layer; IPL, inner plexiform layer; GCL, ganglion cell layer. B: responses to ATP and GABA in OFF- and ON-CAs. Currents were recorded in choline-rich Ringer solution (no. 1-2). C: average of the peak amplitude response to ATP or GABA and the relative peak amplitude of ATP to that of GABA (ATP/GABA) in ON- or OFF-CAs. The peak amplitude of ATP was normalized by the peak amplitude of GABA recorded in the same cell. Values are means ± SE; n = 4 cells from 4 mice for both ON- and OFF-CAs. *P < 0.05. The intracellular solution was KCl (no. In-1).

