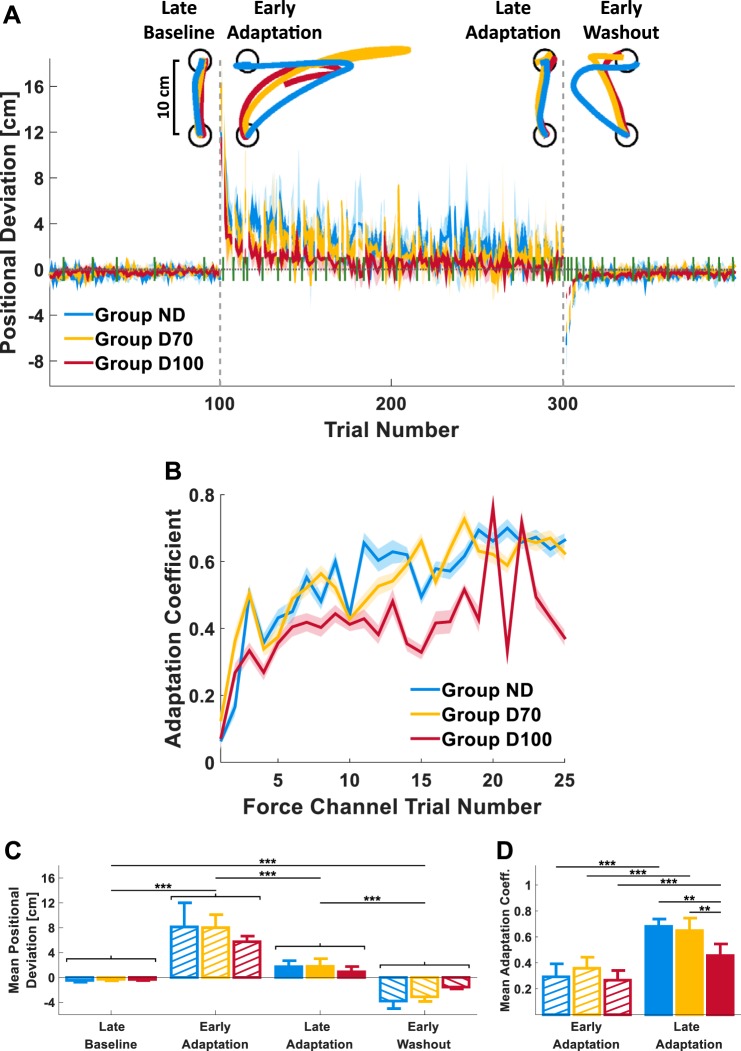
Fig. 3.
Experiment 1: adaptation to nondelayed and delayed velocity-dependent force fields. A: time course of the peak positional deviation averaged over all participants in each group (group ND, blue; group D70, yellow; group D100, red). Vertical dashed gray lines separate the baseline, adaptation, and washout sessions of the experiment. Green bars indicate force channel trials. Individual movements of a single participant from each group during a single non- force channel trial from the late baseline (LB), early adaptation (EA), late adaptation (LA), and early washout (EW) stages of the experiment are presented at top. B: time course of the average adaptation coefficient during the adaptation session. The adaptation coefficient represents the slope of the regression line extracted from a linear regression between the actual force participants applied during a force channel trial and the applied perturbation force during the preceding force field trial. Shading represents the 95% confidence interval in both A and B. C: mean positional deviation of four trials from 4 stages of the experiment (LB, EA, LA, and EW) averaged over all participants in each group. D: mean adaptation coefficient of the first (EA) and last (LA) 5 trials pairs of adjacent force field and force channel trials of the adaptation session. Error bars represent the 95% confidence interval. **P < 0.01; ***P < 0.001.

