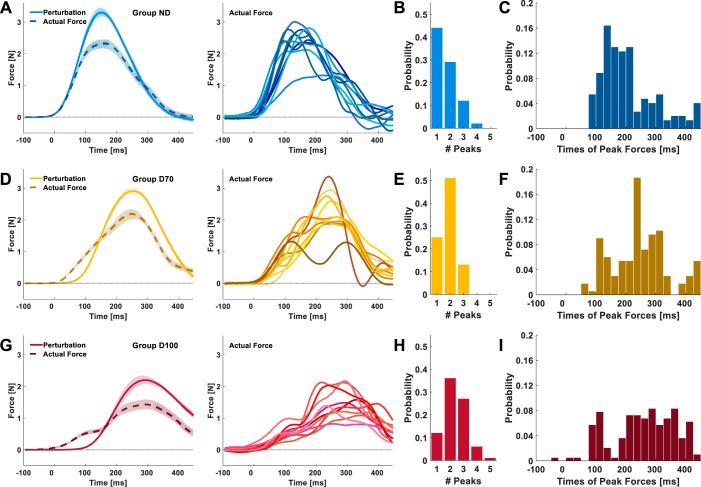
Fig. 4.
Experiment 1: actual forces at the end of adaptation. A, D, and G, left: mean perturbation trajectories (solid lines) and mean actual forces (dashed lines) of all of the participants in each group; group ND (A), group D70 (D), and group D100 (G). The forces depicted are the actual forces that participants applied during the last 10 force channel trials of the adaptation session to cope with the applied perturbations presented in the preceding force field trials. Shading represents the 95% confidence intervals. A, D, and G, right: mean actual forces for each participant from the group on the left. B, E, and H: histograms depict the probability distributions of the number of local peaks in the actual force trajectories from late adaptation [ND (B), D70 (E), and D100 (H)]. C, F, and I: distributions of the times of local peaks in the actual force trajectories [ND (C), D70 (F), and D100 (I)].

