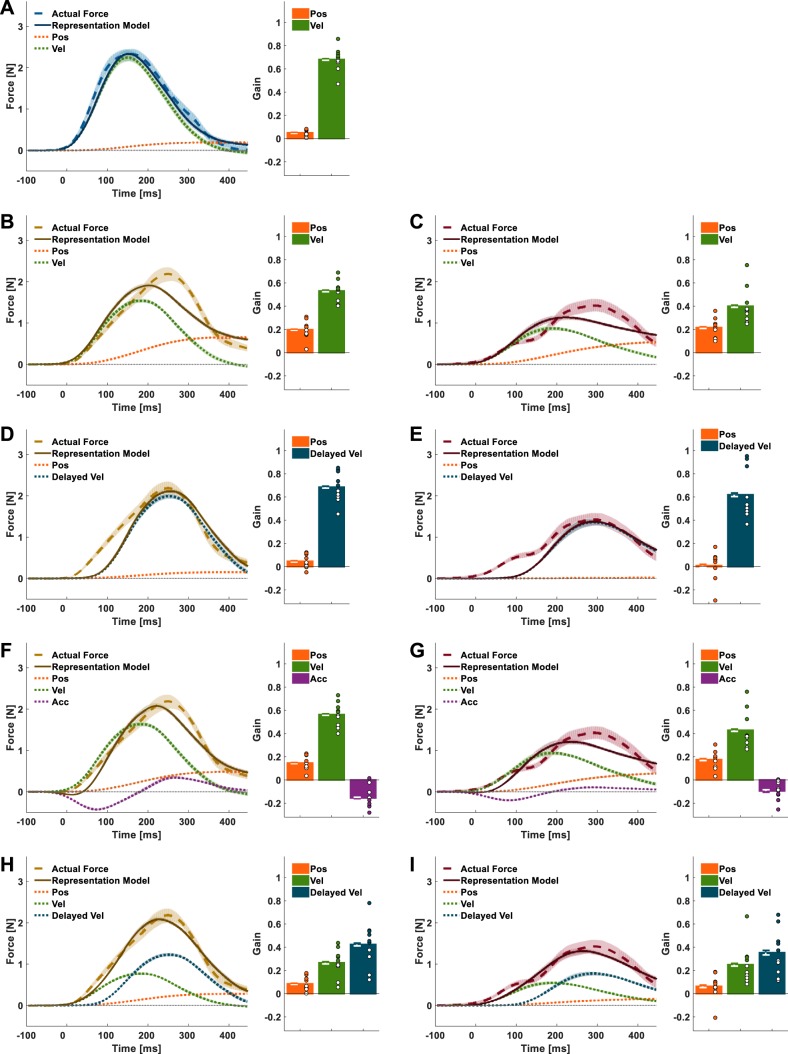
Fig. 5.
Experiment 1: actual forces and fitted representation models. The representation models were constructed according to different combinations of motor primitives. A: the actual forces applied by group ND participants are well fitted by a representation model (solid dark blue line) based on position (dotted orange line) and velocity (dotted green line) movement primitives; bar plots present the normalized gain of each primitive estimated from the linear regression between the actual forces and the combination of specific primitive. B–E: the actual forces that were applied by both group D70 (B and D) and group D100 (C and E) only poorly correspond to either a representation model (solid brown lines and solid dark red lines, respectively) based on current position and velocity movement primitives (B and C) or a model based on position and delayed velocity (dotted dark blue lines) movement primitives (D and E). F–I: a representation model based on current position, velocity, and acceleration (dotted purple lines) movement primitives shows a better fit to the actual forces of group D70 and group D100 participants (F and G), but a representation model based on current position and velocity and delayed velocity movement primitives provides the best fit (H and I) (compared with the other models that we tested). Shading and error bars represent the 95% confidence intervals. Dots represent primitive gains of individual participants.

