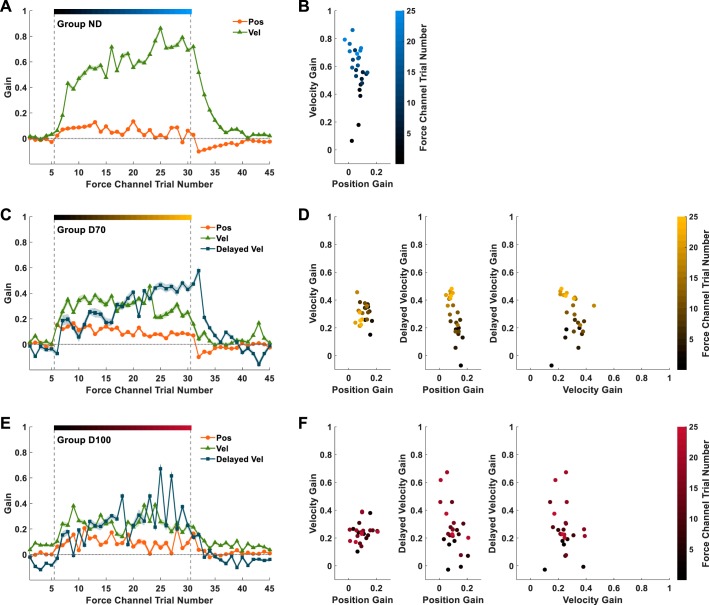
Fig. 6.
Experiment 1: the dynamics of movement primitives’ normalized gains. The gains are presented for the models that best explain the actual force patterns that each group exhibited during the force channel trials. A: time course of the normalized position (orange dots) and velocity (green triangles) gains throughout the experiment for group ND. Shading represents the 95% confidence interval. Vertical dashed gray lines separate the baseline, adaptation, and washout sessions of the experiment. The color gradient bar represents the progression of force channel trials from early (dark blue) to late (light blue) adaptation. B: the normalized gains from the adaptation session in A are plotted in a position/velocity normalized gain space. Each dot represents the primitives’ gain combination in each trial, and the color codes represent the trial number. C and E: time course of the position, velocity, and delayed velocity (dark blue squares) normalized gains throughout the experiment for group D70 (C) and group D100 (E). D and F: normalized gains from the adaptation sessions in C and E, respectively, are plotted in position/velocity (left), position/delayed velocity (middle), and velocity/delayed velocity (right) normalized gain spaces.

