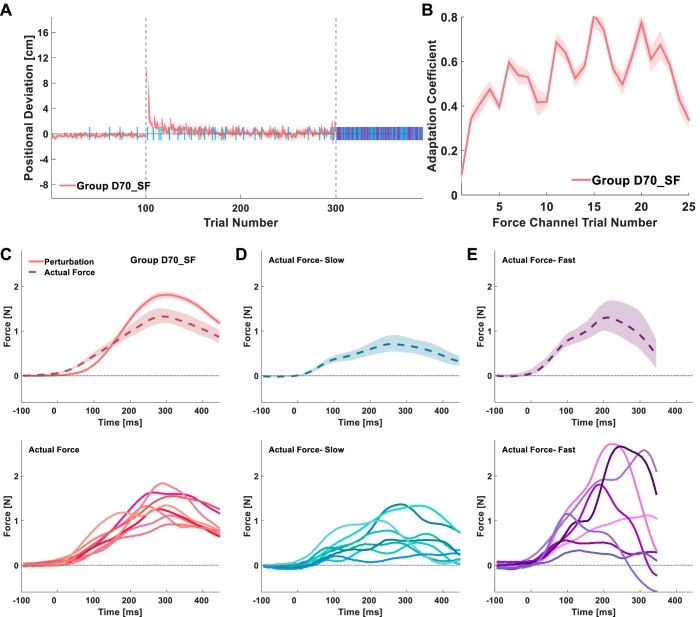
Fig. 8.
Experiment 2: generalization to faster movements; adaptation results and actual forces. A: time course of the peak positional deviation averaged over all of the participants in group D70_SF. Vertical dashed gray lines separate the baseline, adaptation, and generalization sessions of the experiment. Light blue and purple bars indicate force channel trials. B: time course of the average adaptation coefficient during the adaptation session. C: mean perturbation trajectories (solid pink line) and mean actual forces (dashed pink line) from the end of adaptation of all of the participants in group D70_SF (top). The mean actual forces for each participant are presented at the bottom. D and E: mean actual forces of the first 5 slow (light blue; D) and fast (purple; E) trials in the generalization session averaged over all of the participants in the group (top). The mean actual forces for each participant from each of these trial types are presented at the bottom. Shadings represent the 95% confidence interval.

