FIGURE 5.
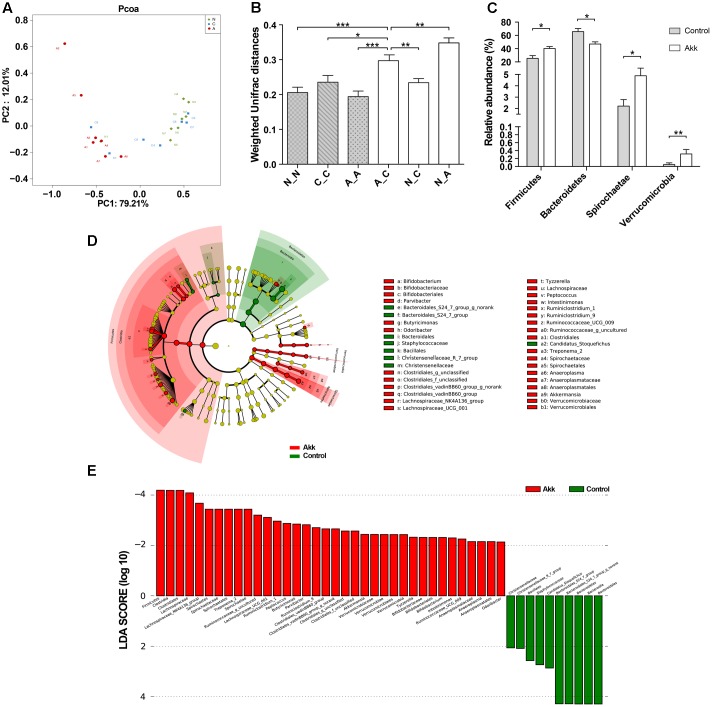
Alteration of the microbial community. (A) PCoA among three groups based on Weighted UniFrac distances. Each point represented a sample. N, group Normal; C, group Control; A, group Akk. (B) Comparisons of pair-wised Weighted Unifrac distances. ANOVA was conducted for multiple comparisons with the LSD method for correction. N_N, C_C, and A_A, indicate intragroup distances; A_C, N_C, and N_A, indicate intergroup distances. (C) Relative abundance of taxa at the phylum level in group Control and Akk. Significance was determined by Wilcoxon rank sum tests. (D) LEfSe cladograms represented taxa enriched in group Control (green) and group Akk (red). Rings from the inside out represented taxonomic levels from phylum to genus. Sizes of circles indicate relative abundance of the taxon. (E) Discriminative biomarkers with twofold changes in LDA scores. Data are shown as the mean ± SEM. ∗P < 0.05, ∗∗P < 0.01, ∗∗∗P < 0.001.

