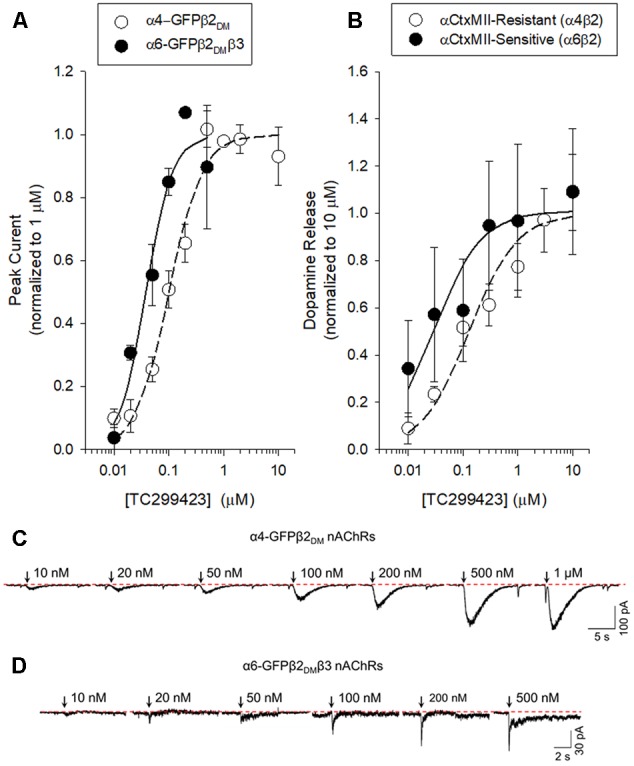
FIGURE 3.

Concentration-response curves for functional responses of TC299423 on nAChRs. (A) Concentration-response relations of TC299423 on α4-GFPβ2DM nAChRs (n = 5–13 cells) and α6-GFPβ2DMβ3 nAChRs (n = 4 cells). (B) Measurement of α4β2∗-mediated α-CtxMII-resistant [3H]-dopamine release and α6β2∗-mediated (α-CtxMII-sensitive) [3H]-dopamine release from WT mouse striatal synaptosomes (see Materials and Methods). EC50 values for (A,B) are given in Table 1. Data for [3H]-dopamine release were normalized to the maximum response calculated from the non-linear curve fits of the results to the Michaelis–Menten equation. Maximal response for the α-CtxMII-resistant release was calculated to be 6.06 ± 0.37 units and maximal response for the α-CtxMII-sensitive release was 0.93 ± 0.08 units. For comparison, 10 μM nicotine elicited 7.78 ± 0.83 units for α-CtxMII-resistant release and 3.63 ± 0.81 units for α-CtxMII-sensitive release. Data are mean ± SEM. SEM values for the normalized data were calculated using Taylor’s expansion. Additional data are presented in the Supplementary Figure S1. (C,D) Representative waveforms of voltage-clamp currents for TC299423 applications at given concentrations on α6-GFPβ2DMβ3 and α4-GFPβ2DM nAChRs. Waveforms are from a single cell for each nAChR subtype. Arrows indicate 500 ms applications and the dotted red line represents the baseline for measurements.
