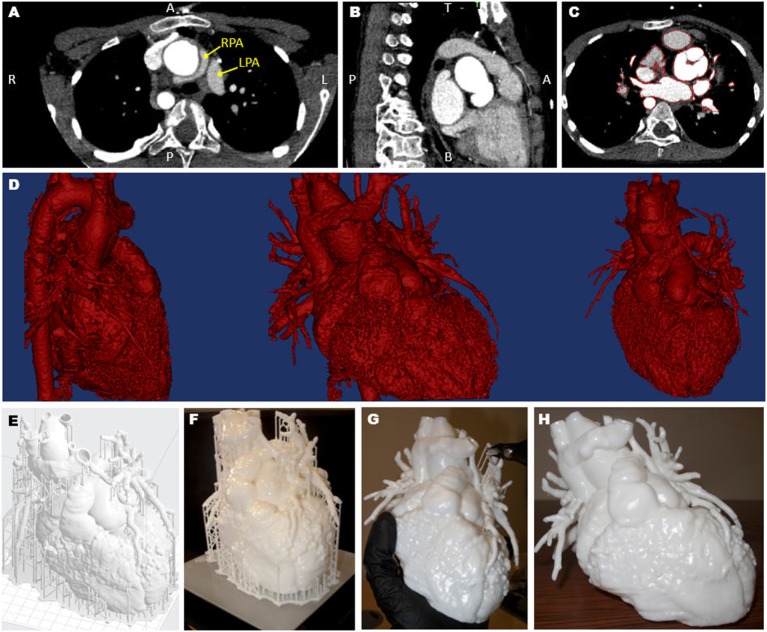
Figure 1.
Views of the computed tomography imaging dataset (A–C) including highlight of the position of the left and right pulmonary artery (LPA and RPA), showing the RPA wrapping around the aorta (A); the red outline in panel (C) shows the regions included in the three-dimensional (3D) model; the data are then rendered in 3D [(D), showing different views]; a scaffold (E) is built around the model prior to 3D printing (F) and the removed (G), resulting in the final patient-specific model (H).

