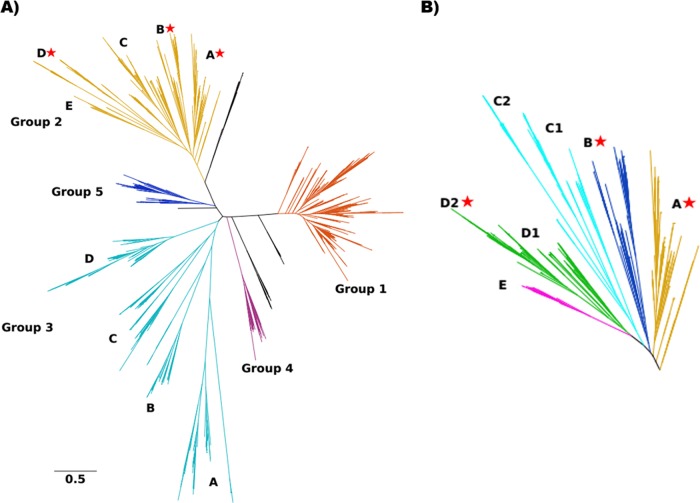
FIG 3.
Maximum-likelihood phylogenetic tree depicting relationships among 1,314 concatenated Etf-α/β sequences. (A) Five distinct phylogenetic groups (shown in distinct colors) that emerged from phylogenetic reconstruction of Etf-β and Etf-α. Sequences that did not belong to any of those groups were left black and are not discussed further (see Table S2 in the supplemental material). Sequences in G2 and G3 were further classified into subgroups (denoted by uppercase letters). (B) Closeup of G2 subgroups, showing further diversity among lineages putatively involved in electron bifurcation; stars denote the presence of biochemically characterized bifurcating Etfs. Sequences in G2D2 have been annotated as FixAB because of their proposed role in nitrogen fixation.

