
FIG 4.
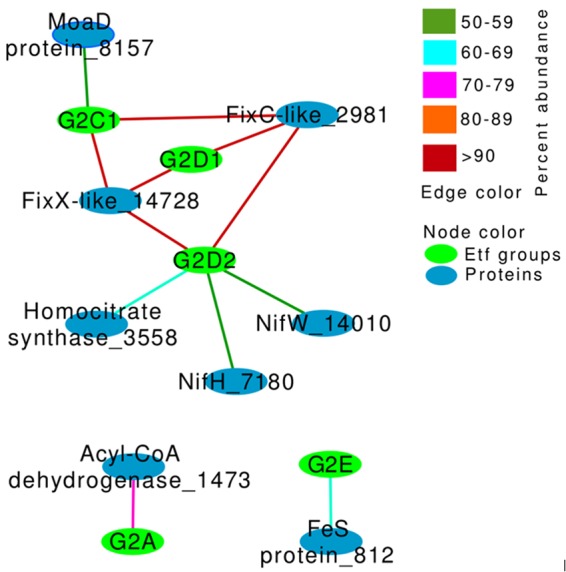
Network depiction of the covariation of proteins encoded in the flanking regions (±20 genes) of etf and specific group designations. Only proteins (n = 8) encoded by ≥50% of the G2 Etf-encoding genomes (i.e., relative frequency of ≥50%) were considered in this analysis. Here, nodes represent either the Etf group designation (green) or proteins in the flanking gene environment of Etfs (blue), while the edge color represents the abundance of the proteins in the group.