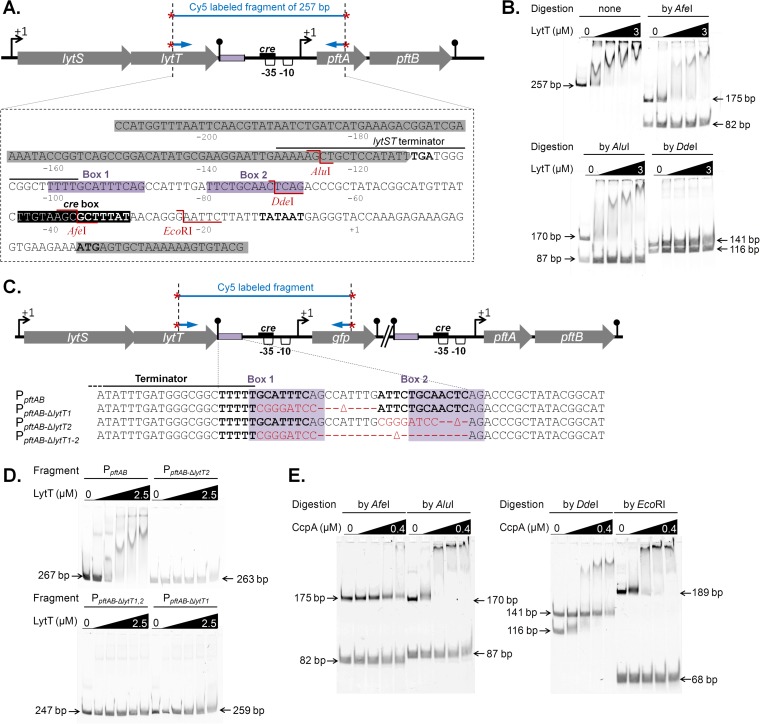
FIG 4 .
Mapping of the LytT and CcpA binding sites. (A) Genomic organization of the lytST pftAB region. At the top of panel A, the black box in the schematic representation indicates the putative binding site of CcpA. The violet boxes indicate the binding region of LytT. The AluI, DdeI, AfeI, and EcoRI restriction sites are indicated in red. (B) EMSAs using purified His6-LytT (0, 1, 1.5, 2, and 3 µM) and the Cy5-labeled PCR fragment of 257 bp (represented in panel A) either uncut or digested with AfeI, AluI, or DdeI. (C) The binding region of LytT is detailed for the unmodified (PpftAB), Box1-deleted (PpftAB-ΔlytT1), Box2-deleted (PpftAB-ΔlytT2), and Box1-Box2-deleted (PpftAB-ΔlytT1,2) reporter strains. Black bold letters stand for the two putative LytT DNA binding sequences (Box1, Box2). The red letters indicate the DNA sequence that replaced the deleted region in each strain. The violet shaded regions are similar to the binding sites identified in E. coli for the LytT-like YpdA response regulator (35). (D) EMSAs using purified His6-LytT (0, 0.5, 1, 1.5, 2, and 2.5 µM) and the Cy5-labeled PCR fragment (represented in panel C) amplified from the PpftAB (267 bp), PpftAB-ΔlytT1 (259 bp), PpftAB-ΔlytT2 (263 bp), and PpftAB-ΔlytT1,2 (247 bp) reporter strains. (E) EMSAs using purified His6-CcpA (0, 0.1, 0.2, 0.3, and 0.4 µM) and P-Ser-HPr (1:10 molar ratio) and the Cy5-labeled PCR fragment of 257 bp (represented in panel A) digested with AfeI (175 and 82 bp), AluI (170 and 87 bp), DdeI (141 and 116 bp), or EcoRI (189 and 68 bp).

