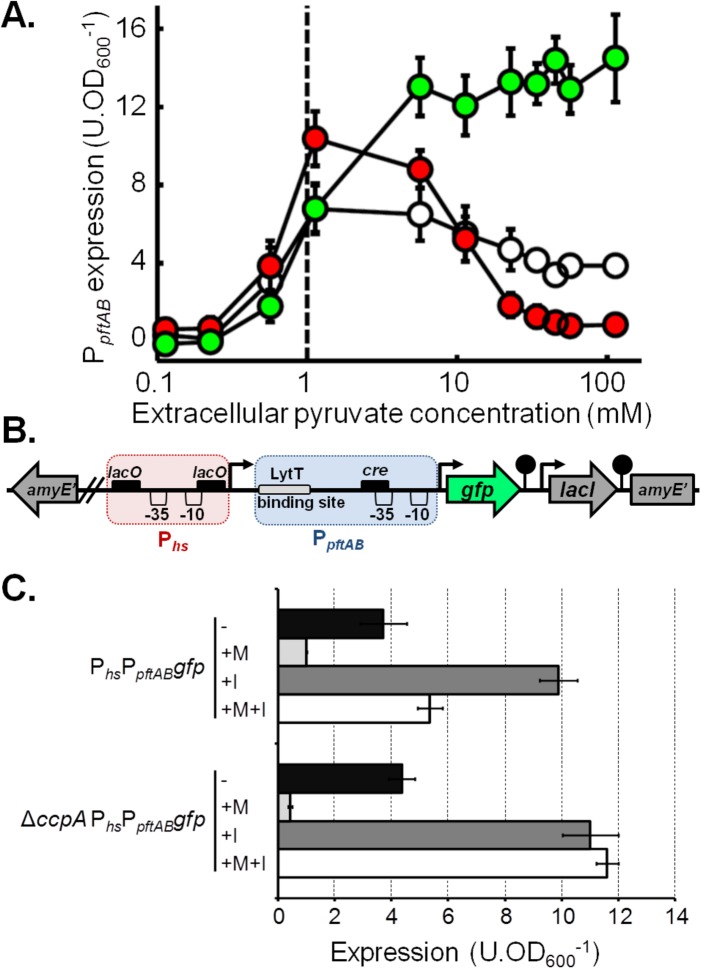
FIG 5 .
Pyruvate influx tightly controls pftAB expression. (A) Expression of pftAB in the WT (white), ΔpftAB (green), and PhspftAB (red) strains grown in M9SE+P (at pyruvate concentrations ranging from 0.1 to 100 mM). The PhspftAB strain was grown with 1 mM IPTG. The dashed line represents the estimated Km of PftAB. (B) Genomic structure of the PhsPpftABgfp at the amyE locus. The red and blue boxes represent Phs and PpftAB, respectively. Black boxes indicate DNA binding sites: cre for CcpA and lacO for LacI. (C) Expression of PhsPpftABgfp in the WT and ΔccpA strains grown in M9SE+P in the presence (+) or absence (−) of malate (M) or 200 μM IPTG (I). Expression was estimated in the exponential phase of growth; mean values ± standard deviations from at least six experiments are presented in panels A and C.

