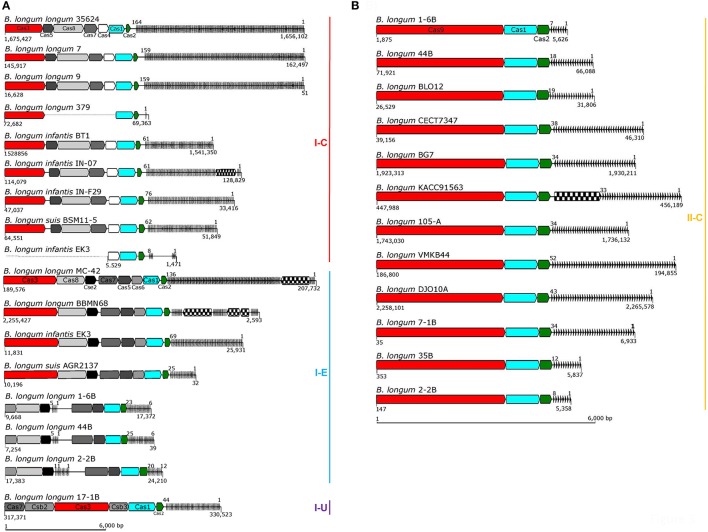
Figure 3.
CRISPR loci in B. longum. The CRISPR locus of each strain was annotated and depicted with signature cas genes colored in red, cas3 for Type I (A) and cas9 for Type II (B), and the universal cas1 and cas2 colored in blue and green respectively. Accessory genes are colored in a gray scale regarding their functional category, CRISPR repeats are represented as black lines on the right side of each locus (spacers are not represented) and transposase are represented with checkboard pattern fill. Numbers below CRISPR-Cas systems represent their position in the genome (or contig) and the numbers on top of the repeat-spacer array represent the number of repeats. The CRISPR loci are represented according to their size, bar scale represents 6 Kb.

