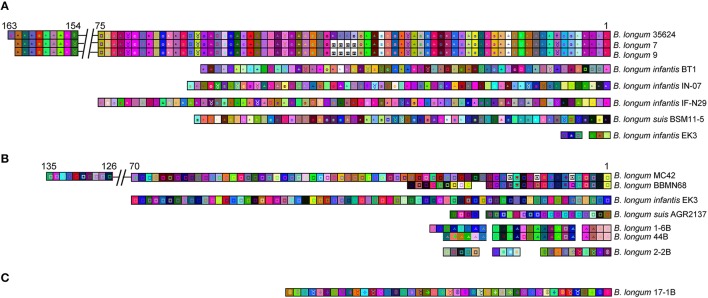
Figure 6.
CRISPR spacers array comparison in B. longum for CRISPR Type I. The CRISPR spacers of CRISPR subtypes I-C (A), subtype I-E (B), and subtype I-U (C) were represented using an Excel Macro tool. The spacers are represented by a square and each unique spacer sequence is indicated as a unique color and geometric figure. Squares containing and “X” represent deleted or missing spacers. The last spacer acquired is represented on the left side while the first spacer is on the right side. Numbers on top of the spacers array indicates the first and last spacer showing the size of the array. The long arrays were reduced for a better representation and are indicated with a double line break.

