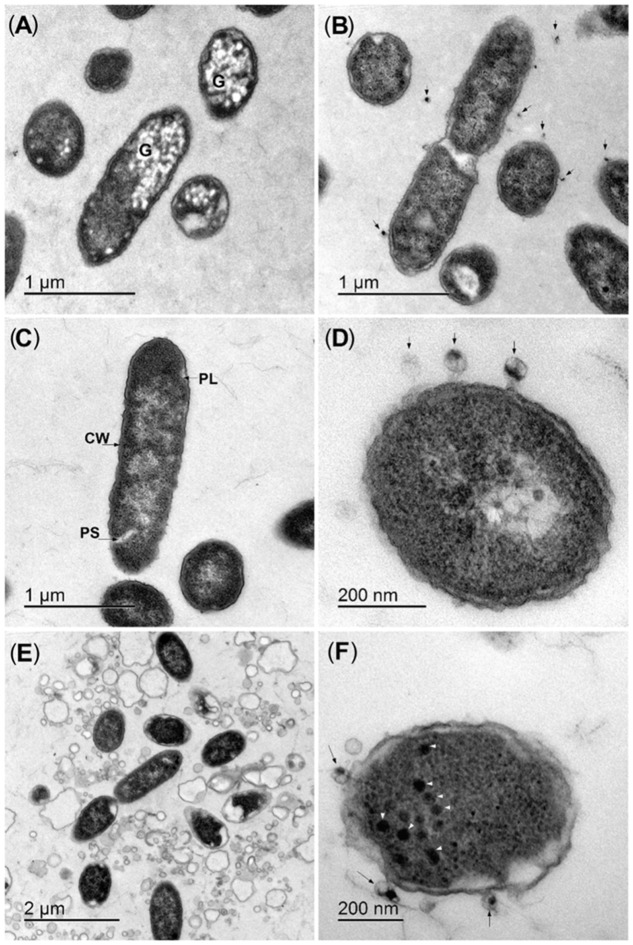
FIGURE 3.
Representative ultrastructure analyses of bacteria–bacteriophage interactions. (A,B) Strain UDL-4 before (A) and after (B) mixing with bacteriophage BF25/12 (arrows). (C,D) Strain UDL-3 before (C) and after (D) mixing with bacteriophage BF25/12 (arrows). (E,F) Lysed UDL-3 bacteria from the border of a plaque (E) and new bacteriophages in the cytoplasm (arrowheads) (F). G, intracellular granules; CW, cell wall; PL, plasmalemma; PS, periplasmic space.

