
FIG 1.
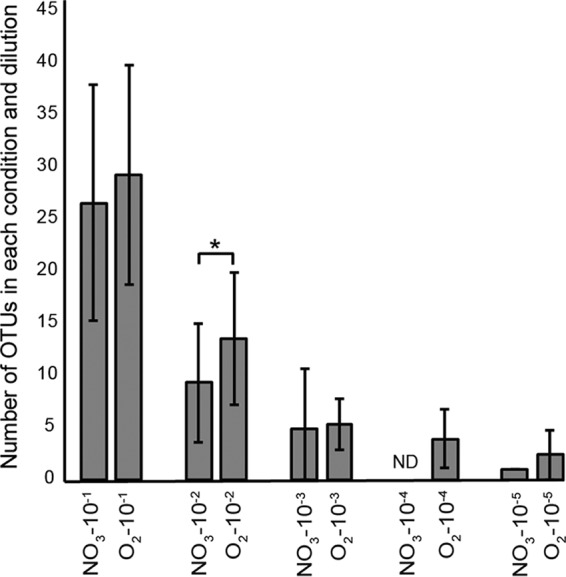
For each experiment and dilution, the mean number of OTUs assigned. Error bars represent standard deviations. Statistical significance between means was tested using Student's t test for the first three dilutions (10−1 to 10−3). Significance (P < 0.05) is marked with an asterisk. ND, no data acquired for that set of samples.