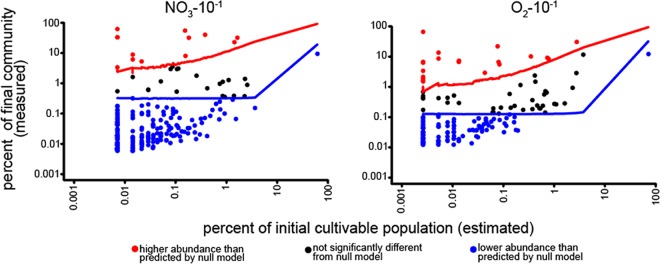
FIG 6.
Each OTU's final average percent abundance plotted against initial estimated percent abundance for the nitrate-reducing (left) and anaerobic (right) enrichments begun with the most concentrated inoculum. Red and blue lines indicate the upper and lower boundaries, respectively, of the 99% confidence interval of expected average abundance in 10,000 communities simulated in the null model of community assembly. Note the log scale. The right-most point in both graphs represents the Pseudomonas OTU New.ReferenceOTU30.

