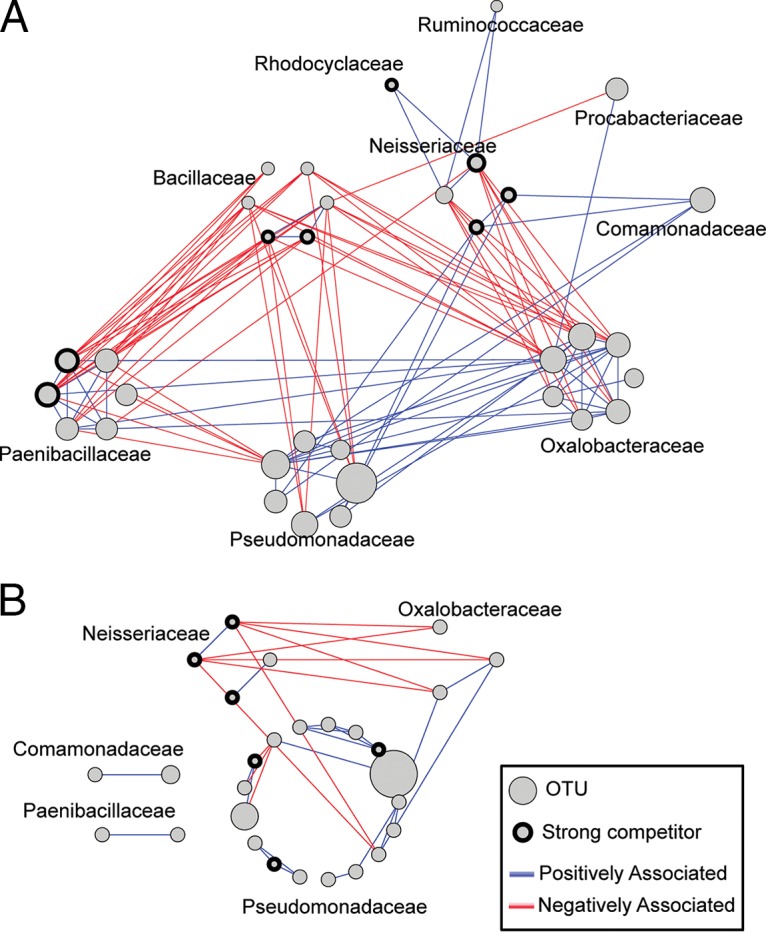
FIG 8.

Networks depicting positive and negative associations between pairs of taxa in anaerobic nitrate-reducing communities (A) and aerobic communities (B). Graphs were made by the union of interaction graphs at each dilution for aerobic and anaerobic samples, respectively. Positive associations are shown in blue and negative associations in red. OTUs predicted to be strong competitors (Fig. 6 and 7) are indicated with a bold outline. The size of the node for each OTU scales with the estimated number of cultivable units of that OTU in the initial inoculum (Fig. 5).
