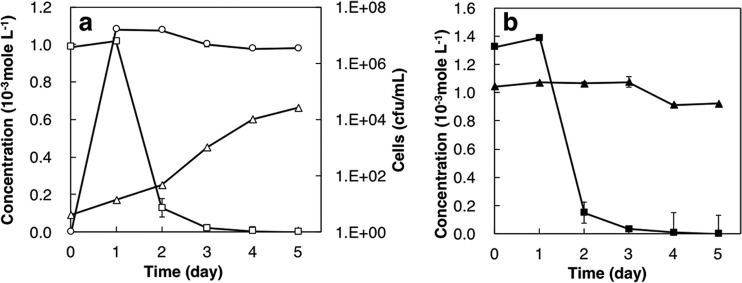
FIG 1.
Time course of soluble Sr, NH4+, and cell growth (a) and soluble Ca and Mg in the Sr removal test (b) using the TK2d strain under 3.0% NaCl. Open squares, soluble Sr concentration; open triangles, NH4+ concentration; open circles, viable cell number; closed squares, soluble Ca concentration; closed triangles, soluble Mg concentration.

