FIGURE 3.

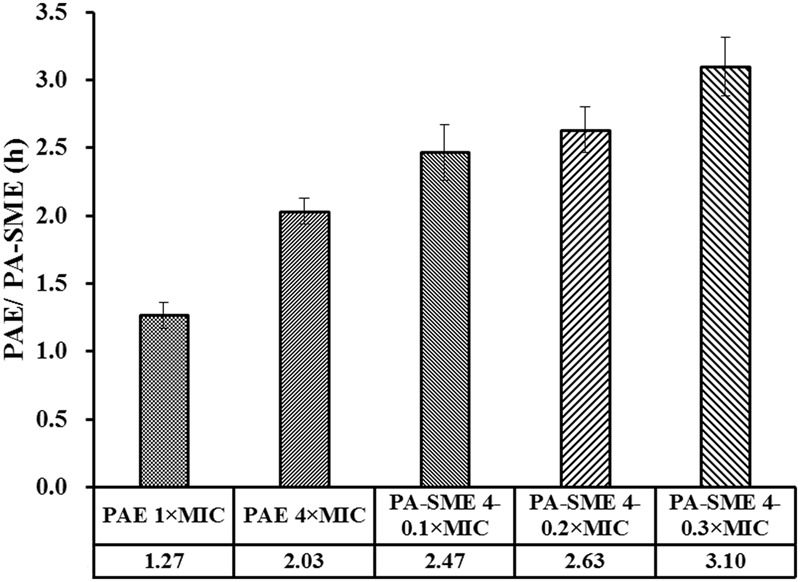
PAE and PA-SME values (h) of tulathromycin against S. suis ATCC 43765. The PA-SMEs were determined after initial exposure to tulathromycin at 4× MIC. The error bars represent SD (n = 3).

PAE and PA-SME values (h) of tulathromycin against S. suis ATCC 43765. The PA-SMEs were determined after initial exposure to tulathromycin at 4× MIC. The error bars represent SD (n = 3).