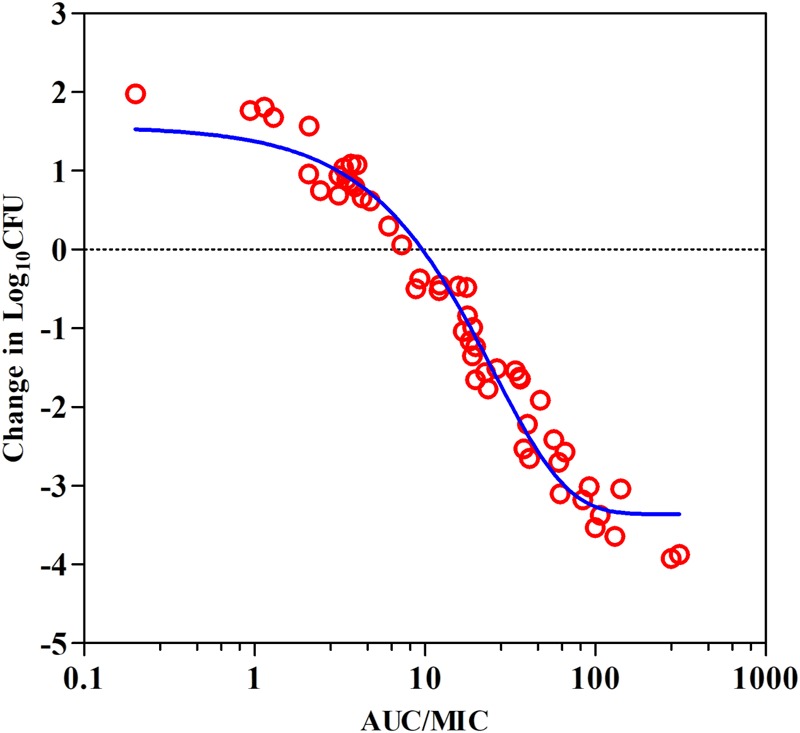
FIGURE 4.

Plots of ex vivo AUC/MIC ratios versus the change of bacterial counts between 0 and 12 h (log10 CFU/mL) against S. suis ATCC 43765 in the porcine serum. The line represents the curve of predicted values based on the sigmoid Emax equation, and the points represent serum samples collected at time points from 0 to 360 h.
