
FIGURE 6.
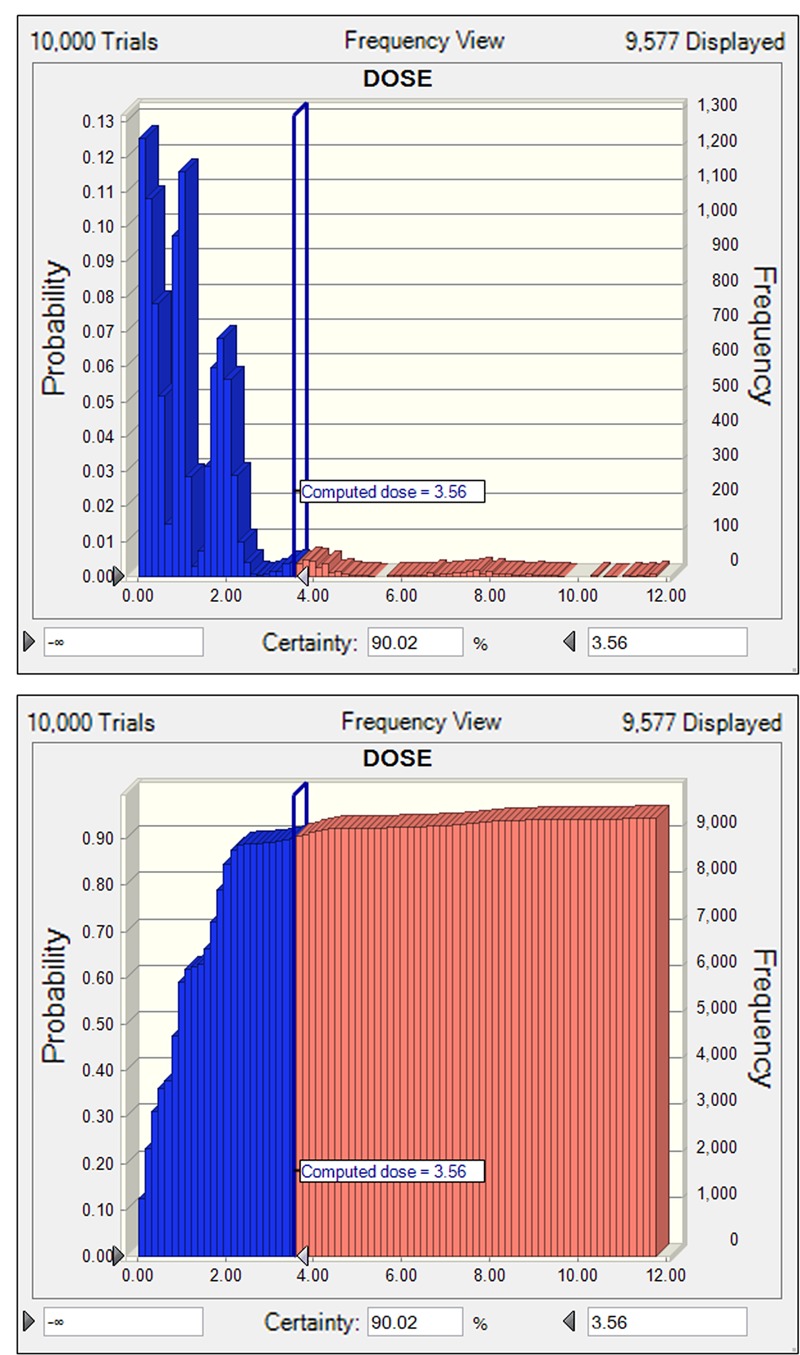
The non-cumulative (A) and cumulative (B) distributions of tulathromycin doses for S. suis, as predicted by a PK/PD model for a duration of 5 days activity in terms of probability of target attainment (PTA). The vertical bar indicates the computed target dose at the cumulative PTA of 90%. Dose (0–12 mg/kg) is indicated on the x-axis.