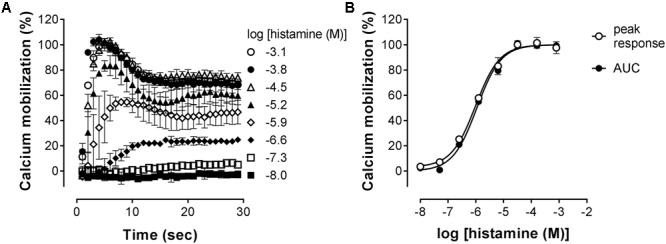
FIGURE 3.

Histamine-induced intracellular calcium mobilization in HeLa cells endogenously expressing the H1R. (A) Calcium dependent fluorescence was measured over time after injection of increasing histamine concentrations at t = 0. Representative graphs are shown of ≥3 experiments depicting the mean ± SD of duplicate values (n = 2). (B) For comparison, peak response and area under the curve (AUC) were determined from the kinetic calcium mobilization traces and plotted against the histamine concentration.
