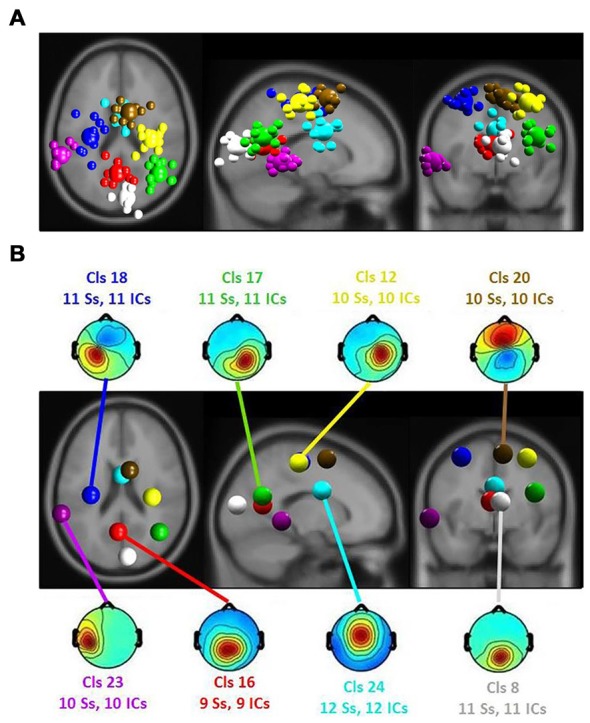
Figure 5.

(A) Equivalent-dipole locations of main clusters’ independent components (ICs; small spheres) and their centroids (larger spheres), projected to the horizontal, sagittal and coronal views of the standard Montreal Neurological Institute (MNI) brain. (B) Clusters’ centroids and their scalp maps, marked with cluster number (Cls #), number of participants (# Ss) and number of ICs (# ICs) for each cluster in the corresponding color.
