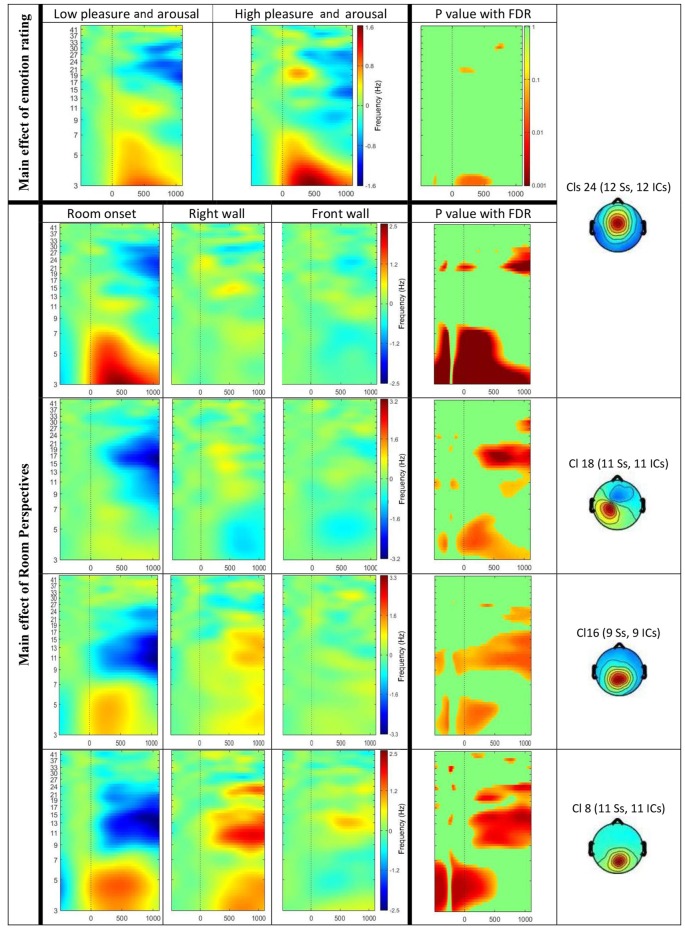
Figure 6.
Event-related spectral perturbation (ERSP) results for the main effect of visual sequences (Top) and emotion rating (Bottom). The Y-axis shows frequency (Hz) from 3 Hz to 41 Hz and the X-axis shows time (ms) from −500 ms to 1200 ms. Significant results displayed for ERSPs in or near the anterior cingulate cortex (ACC; Cls 24), the left precentral gyrus (Cls 18), the posterior cingulate cortex (Cls 16) and the occipital lobe (Cls 8). Top row displays differences in ERSP dependent on the emotional ratings for the lower pleasure and arousal group compared to the higher pleasure and arousal group. The room perspectives are displayed in the order starting with room onset, followed by onset of the right wall and the front wall. Significant differences are marked with exact p values with FDR correction in the most right columns.

