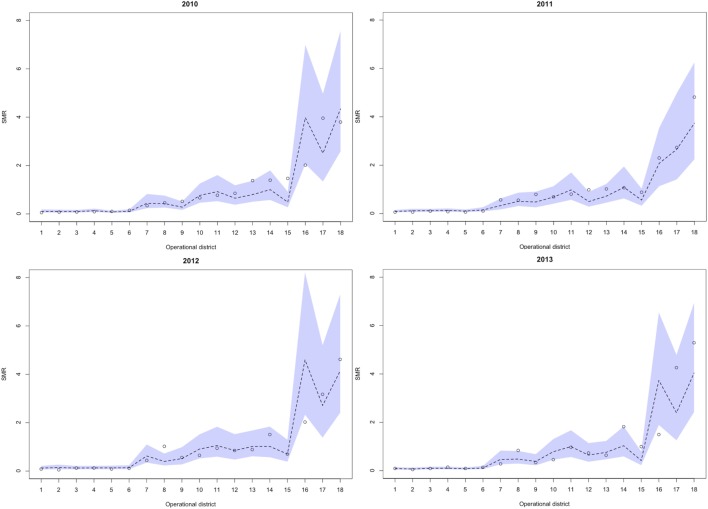
Figure 3.
Observed versus predicted uncertainty range of the SMR in operational health districts at each interval of time during the study period (2010–2013). Numbers presented below the horizontal axis indicate respective health operational districts; 1: Sangkae, 2: Preah Netr Preah, 3: Thma Koul, 4: Mobkov Borei, 5: Thma Puok, 6: Ou Chrov, 7: Bakan, 8: Sampov Loun, 9: Mong Russei, 10: Siem Reap, 11: Battambang, 12: Sot Nikum, 13: Angkor Chum, 14: Pailin, 15: Kralanh, 16: Sampov Meas, 17: Samaraong, 18: Tbeng Meanchey. SMR, standardized morbidity ratio.

