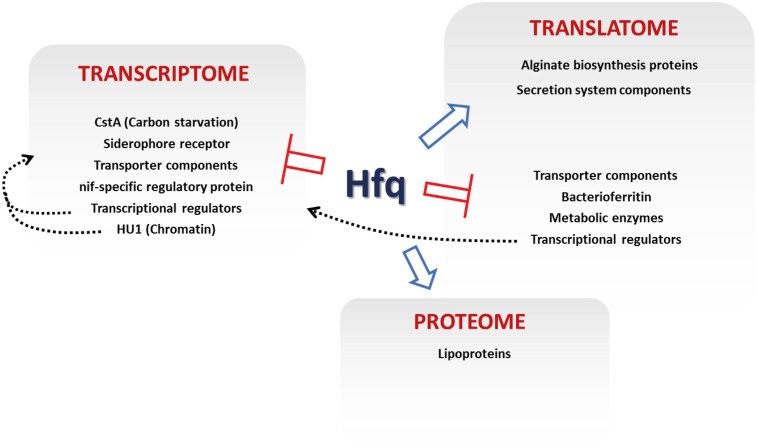
FIGURE 5.
Regulatory effects of Hfq in P. fluorescens. The key loci controlled by different levels of Hfq regulation are indicated. Blue arrows show positive Hfq control, red bars denote negative control. Dashed gray arrows show proposed indirect regulations by transcriptional regulation and chromatin remodeling.

