Figure 7.
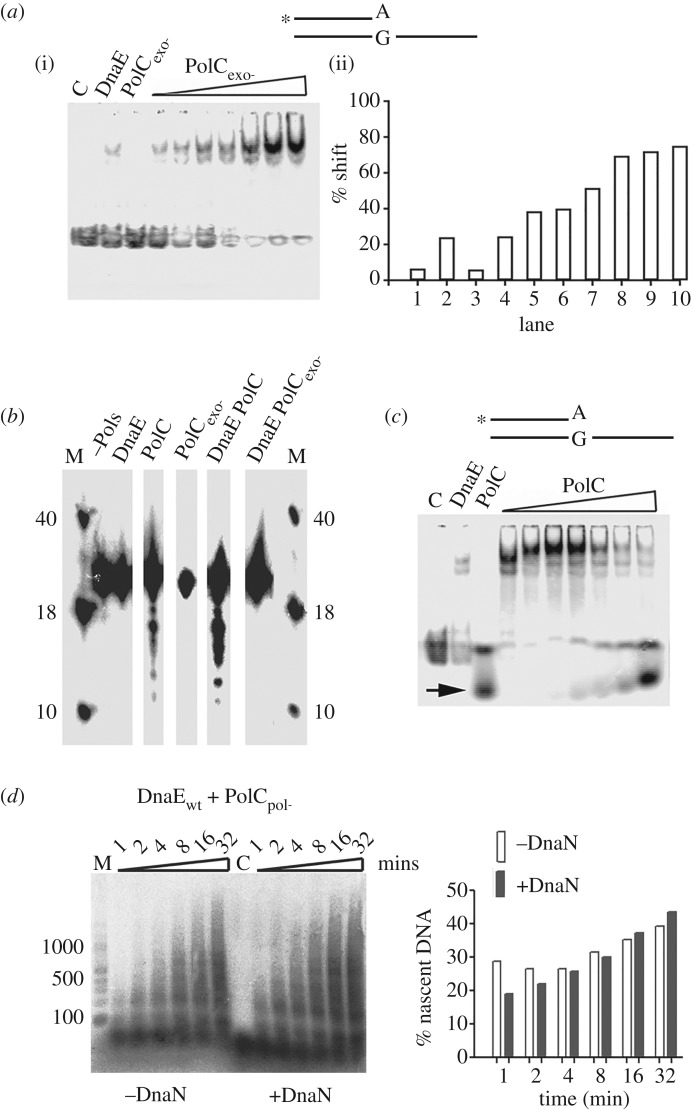
PolC is recruited by DnaE at 3′-OH primed sites via protein–protein interaction and DnaE exposes 3′-OH ends to the exonuclease domain of PolC. (a) EMSA showing the effects of increasing concentrations (25, 50, 100, 250, 500, 750 and 1000 nM) of PolCexo- on complexes of DnaE (1 µM) with radiolabelled (asterisk) primed 3′-mismatch (A:G) DNA substrate (0.66 nM). Lanes labelled C, DnaE or PolCexo- represent the control radiolabelled DNA substrate on its own, in the presence of 1000 nM DnaE, or PolCexo-, respectively. Quantification of the percentage shift in every lane is shown in the bar graph. (b) PolC exonuclease assays. The assays were carried out with 80 nM of DnaE, PolC or PolCexo- or with equimolar concentrations of DnaE and PolC (wild-type and mutants) proteins. Reaction mixtures were pre-incubated at 37°C for 5 min prior to initiation of the reaction by adding the appropriate polymerase(s). The reactions were terminated after 15 min by boiling for 5 min. Samples were mixed with loading buffer and resolved through 15% (v/v) urea gel denaturing polyacrylamide gel. Lanes labelled M show molecular markers (40, 18 and 10 bases) and the lane labelled –Pols represents the control radiolabelled substrate. (c) EMSA showing the effects of increasing concentrations (25, 50, 100, 250, 500, 750 and 1000 nM) of wild-type PolC on complexes of DnaE (1 µM) with radiolabelled (asterisk) primed 3′-mismatch (A:G) DNA substrate (0.66 nM). Lanes labelled C, DnaE or PolC represent the control radiolabelled DNA substrate on its own, in the presence of 1000 nM DnaE, or PolC, respectively. DNA fragments digested by the 3′ > 5′ exonuclease activity of PolC are shown with an arrow. (d) Time course reactions carried out on RNA-primed M13mp18 template (2 nM) with DnaE and PolCpol- (80 nM each) and in the presence or absence of DnaN (80 nM) as indicated. Reactions were carried out and analysed as in figure 4. Quantifications of the percentage of nascent DNA synthesized in the presence and absence of DnaN are shown in the bar graph.

