Figure 1.

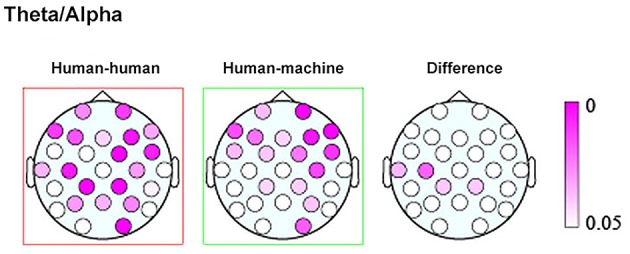
Topographic maps showing the p values of the theta/alpha amplitudes during human–human (left) and human–machine (center) conditions, as well as their difference (right). Taken and modified from Kawasaki et al. (2013).

Topographic maps showing the p values of the theta/alpha amplitudes during human–human (left) and human–machine (center) conditions, as well as their difference (right). Taken and modified from Kawasaki et al. (2013).