
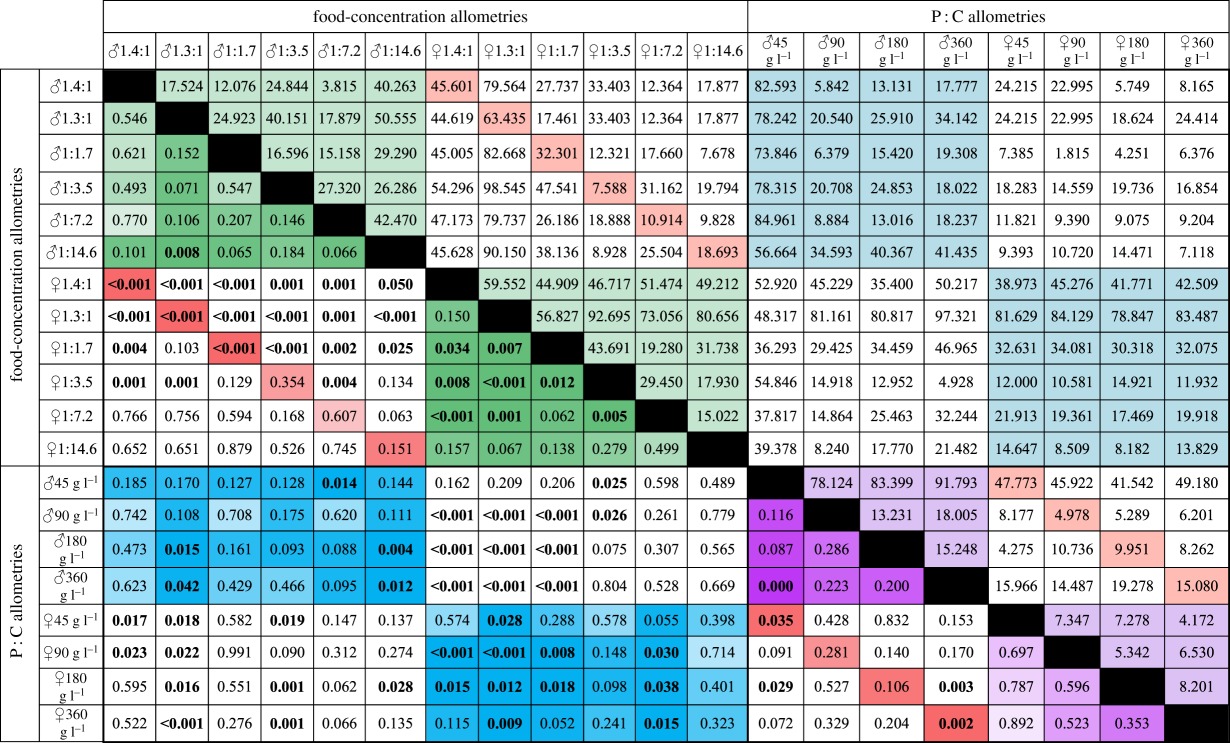
Table 5.
Pairwise comparisons of allometries generated in response to variation in caloric value (food-concentration allometries) at different P : C ratios and in response to variation in P : C ratio (P : C allometries) at different food concentrations, in males (♂) and females (♀). Angles between allometric vectors are shown above the diagonal and uncorrected p-values are shown below the diagonal. Values of p of less than 0.05 are shown in bold. The darker the cell the lower the p-value. Green cells show comparison among food-concentration allometries within each sex; purple cells show comparison among P : C allometries within each sex; blue cells show comparison between food-concentration and P : C allometries within each sex; and red cells shows comparisons between male and female allometries.
 |