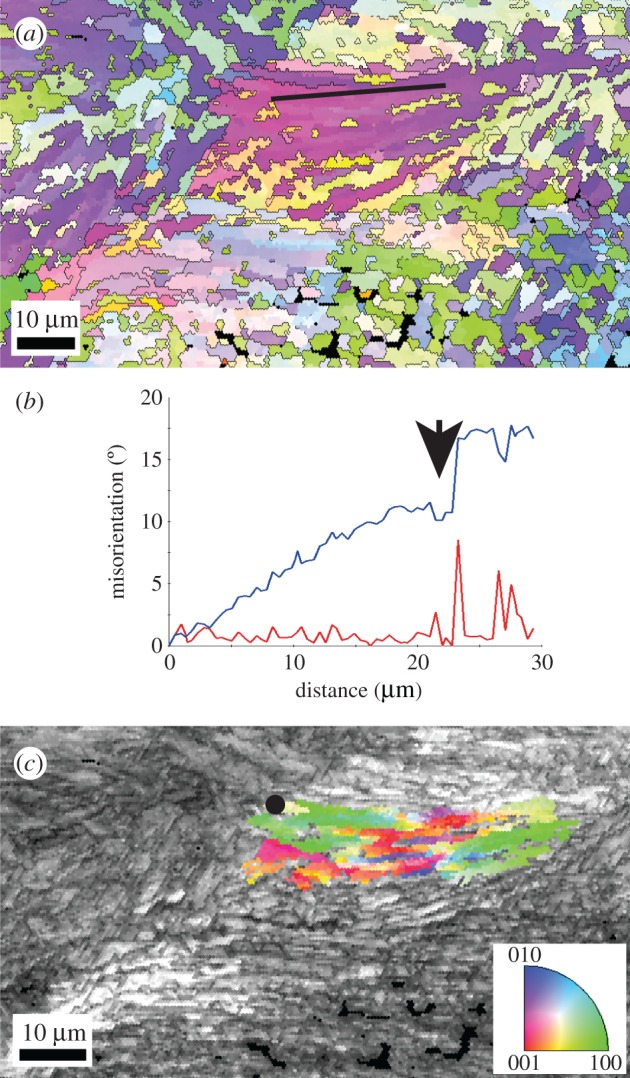
Figure 3.

Region of interest marked with a black arrow in figure 2a. (a) Crystallographic orientation map coloured according to the aragonite inverse pole figure colour code (inset in (c)) and detailed in figure 2. (b) Misorientation profile (black line in (a)) showing change in crystal orientation with a misorientation angle of approximately 15° across approximately 30 µm. Red curve = point to point values, blue curve = point to origin values. Arrow indicates a subdomain boundary. (c) Image quality map where different levels of grey indicate the EBSD pattern quality—clear, high quality patterns in light grey, lowest quality patterns in dark grey. In colour, the ‘grain’ reference orientation deviation axes, showing the deviation of crystallographic orientation relative to the black point in the map (colour reference as inset).
