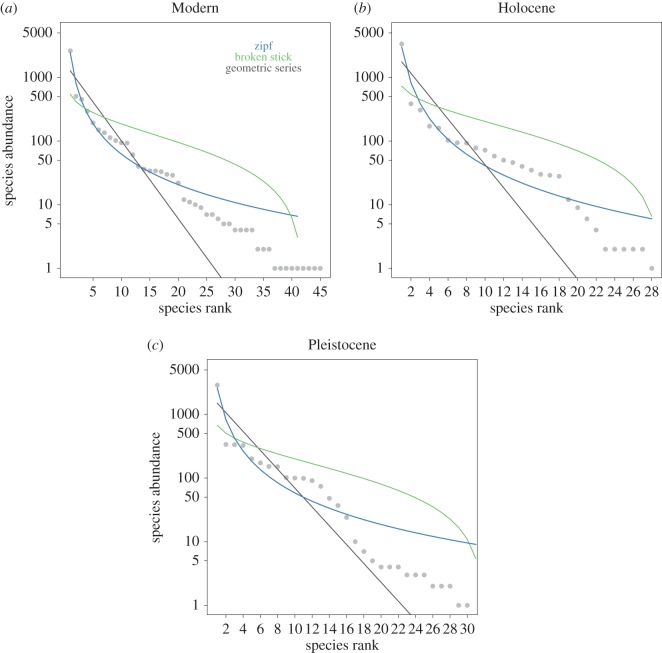
Figure 3.
Rank abundance distribution for (a) Modern, (b) Holocene and (c) Pleistocene assemblages. Fossil assemblages were resampled to total Modern assemblage abundance (n = 5176). The lines for fits of three rank abundance distribution models are overlaid, where Zipf is the best-fitting model for all time periods (electronic supplementary material, table S2).

