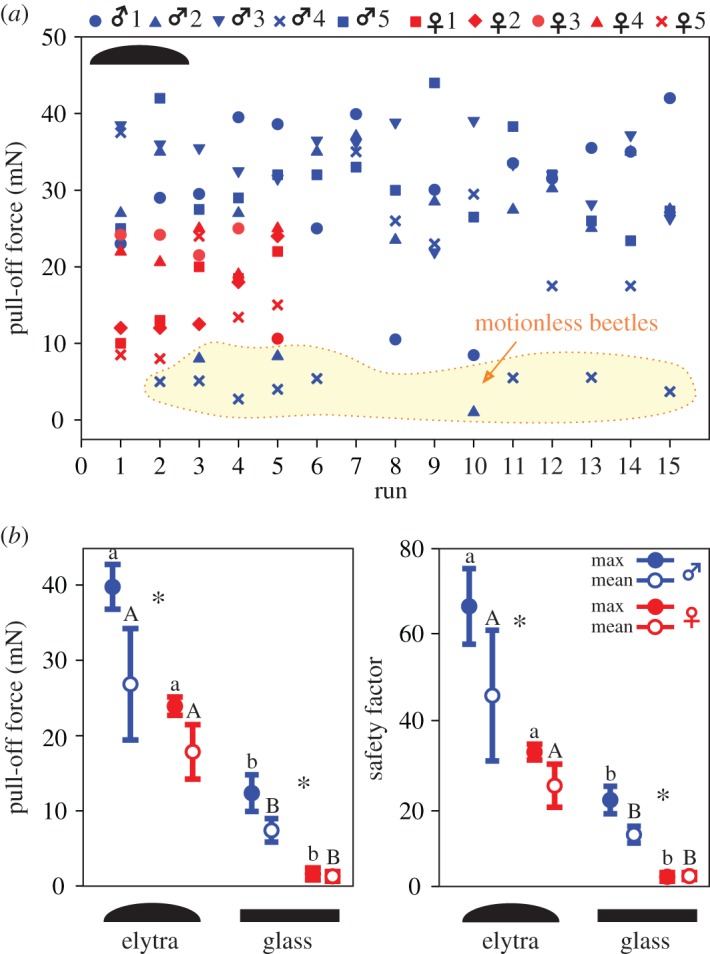
Figure 4.

Pull-off forces and safety factors generated by male and female rosemary beetles on female elytra and a flat glass slide. Blue symbols and lines correspond to males and red ones to females. (a) Multiple scatterplot of force values for five males and five females, obtained in 15 and 5 consecutive runs on elytra, respectively. The yellow shading, surrounded by the dotted line, indicates values which were obtained by pulling off motionless beetles. (b) Scatter plot column, means and error bars, of maximum and mean pull-off forces and safety factors. Asterisks indicate statistical differences between males and females (n♂♂ = 5, n♀♀ = 5) according to t-test: t = 2.4, p = 0.041 (mean force), t = 11.0, p ≤ 0.001 (maximum force), t = 2.9, p = 0.019 (mean safety factor), t = 8.4, p ≤ 0.001 (maximum safety factor) on elytra; t = 8.4, p ≤ 0.001 (mean force), t = 9.4, p ≤ 0.001 (maximum force), t = 11.1, p ≤ 0.001 (mean safety factor), t = 11.9, p ≤ 0.001 (maximum safety factor) on glass. Different small letters and capitals show differences between elytra and glass for males and females, respectively, according to t-test, in males: t = −5.7, p ≤ 0.001 (mean force), t = −16.0, p ≤ 0.001 (maximum force), t = −4.7, p = 0.002 (mean safety factor), t = −10.7, p ≤ 0.001 (maximum safety factor), in females: t = −10.2, p ≤ 0.001 (mean force), t = −34.3, p ≤ 0.001 (maximum force), t = −9.6, p ≤ 0.001 (mean safety factor), t = −30.6, p ≤ 0.001 (maximum safety factor).
