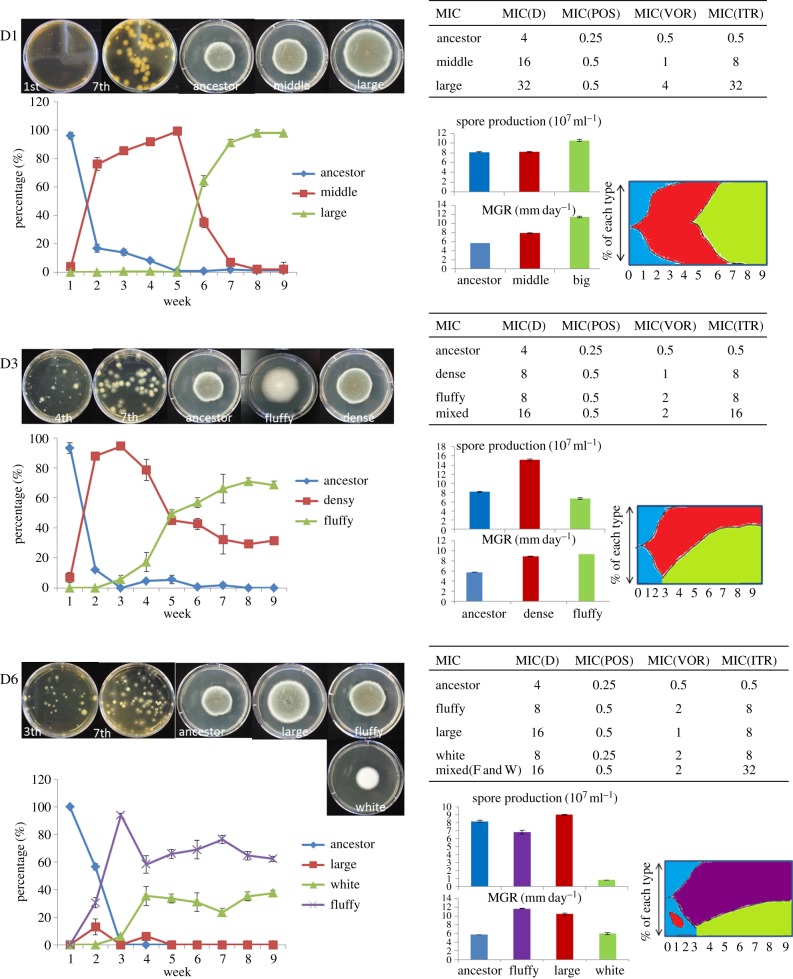
Figure 2.
Population dynamics within evolving lineages. Pictures and data show characteristics (frequency changes, growth rates, spore production and MIC value) of different morphotypes in three difenoconazole lineages that evolved in the presence of difenoconazole. Top left shows the morphology of different types in each lineage when grown on MEA plates mixed with other types or alone. Bottom left shows the frequency dynamics of each different morphotypes over the experimental evolutionary time of nine weeks (extended two more weeks to confirm trend changes). Spore production was measured after 7 days of growth at 37°C and MGRs were measured after 4 days. Resistance level was checked following the guidelines of the European Committee on Antimicrobial Susceptibility Testing (EUCAST). Error bars indicate the standard error of the mean (s.e.m.). The colour diagram is based on the frequency of each morphotype. (Online version in colour.)

