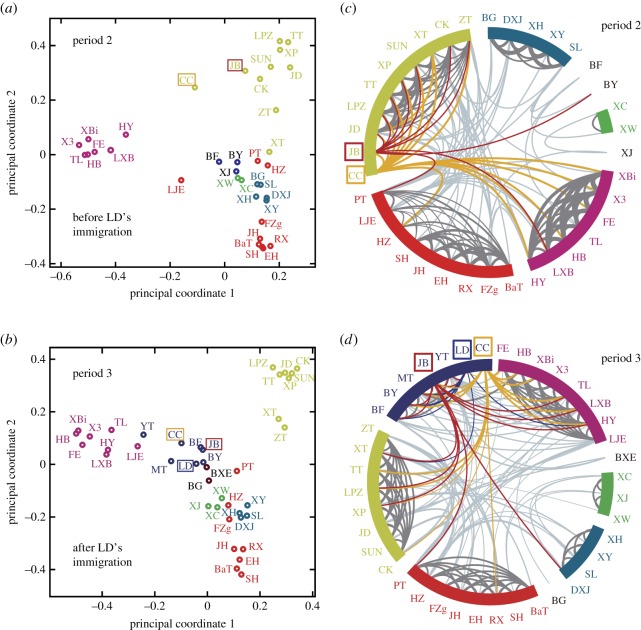
Figure 3.
(a,b) Principal coordinates analysis (PCA) showing affiliation pattern shifts between individuals. Distances between nodes are inversely proportional to the square root of their HWIs and represent dyadic affiliation distances between individuals. (c,d) The affiliation sociograms of the GNG-AMB. The width of the bonding lines connecting individuals denotes the strength of affiliation. The filter threshold of the HWI value is 0.17. The two periods were divided by a single event involving an adult male (LD) entering the GNG-AMB and then recruiting young bachelor males already present in the AMB to form a new subgroup principally based on kinship. Node colours represent individuals belonging to different subgroups.

