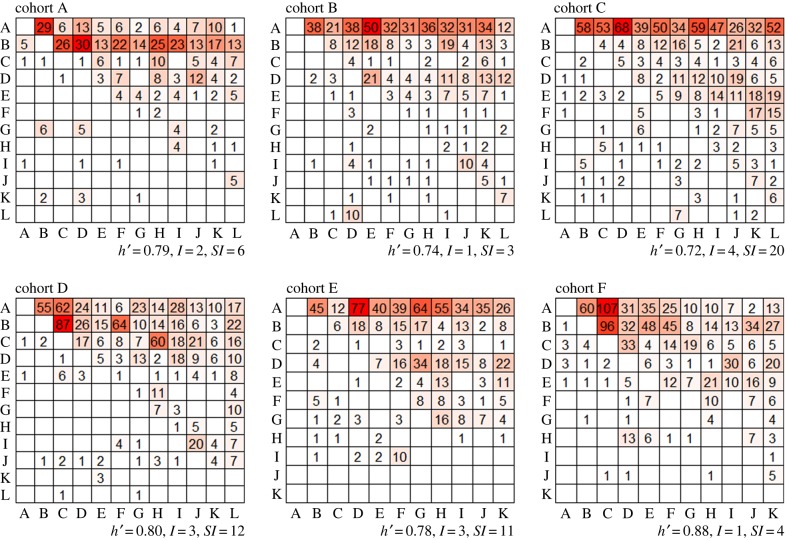
Figure 1.
Win–loss sociomatrices showing total wins and losses by each individual in group housing. Cells are colour-indexed from white (no wins) to darker colours (highest number of wins). Winners of each contest are listed in rows and losers are listed in columns according to I & SI rank order. All six cohorts formed a significantly linear social dominance hierarchy. Empty cells indicate that the frequency of aggressive interactions was 0. (Online version in colour.)

