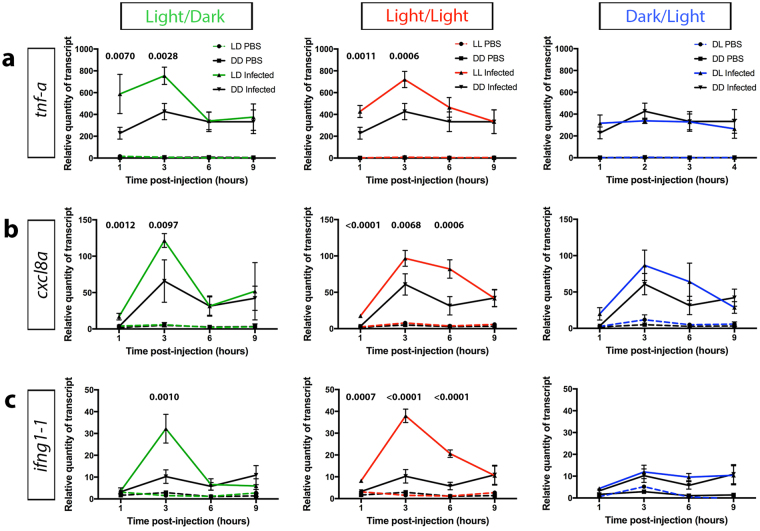
Figure 5.
Larvae infected under light exposure demonstrate elevated expression of pro-inflammatory cytokines. (a–c) qPCR analysis of tnf-a (a) , cxcl8a (b) and ifng1-1 (c), from whole larvae raised under light/dark, constant light and dark/light conditions in comparison to constant darkness, measured at 1, 3, 6 and 9 hours post-injection. Data represent three biological replicates; data shown as mean ± s.d.; p-values were calculated by one-way ANOVA with Tukey’s multiple comparisons test; LD, light/dark; LL, constant light; DL, dark/light; DD, constant darkness.

