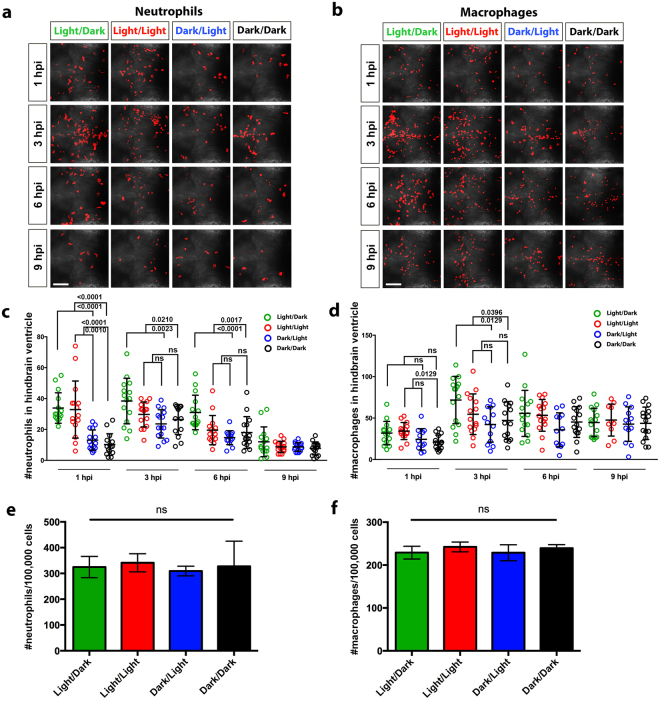
Figure 6.
Larvae infected under light exposure demonstrate greater recruitment of neutrophils and macrophages to the hindbrain ventricle. (a) Immunofluorescence detection of neutrophils at 1, 3, 6 and 9 hpi within the hindbrain region of infected Tg(lyz:DsRED2) nz50 larvae raised under light/dark, constant light, dark/light and constant dark conditions. (b) Immunofluorescence detection of macrophages at 1, 3, 6 and 9 hpi within the hindbrain region of infected Tg(mpeg1:Gal4-FF) gl25 ;Tg(UAS-E1b:nfsB.mCherry) c264 larvae raised under light/dark, constant light, dark/light and constant dark conditions. (c) Quantification of neutrophils in the hindbrain region of individual infected Tg(lyz:DsRED2) nz50 larvae, as detected in (a). (d) Quantification of macrophages in the hindbrain region of individual Tg(mpeg1:Gal4-FF) gl25 ;Tg(UAS-E1b:nfsB.mCherry) c264 larvae, as detected in (b). (e,f) Flow cytometry quantification of neutrophils and macrophages from Tg(lyz:DsRED2) nz50 and Tg(mpeg1:Gal4-FF) gl25;Tg(UAS-E1b:nfsB.mCherry) c264 larvae, respectively, raised under light/dark, constant light, dark/light and constant dark conditions. Data represent three biological replicates. Scale bar, 50 μm; data shown as mean ± s.d.; hpi, hours post-infection; p-values were calculated by one-way ANOVA with Tukey’s multiple comparisons test; ns, not significant.

