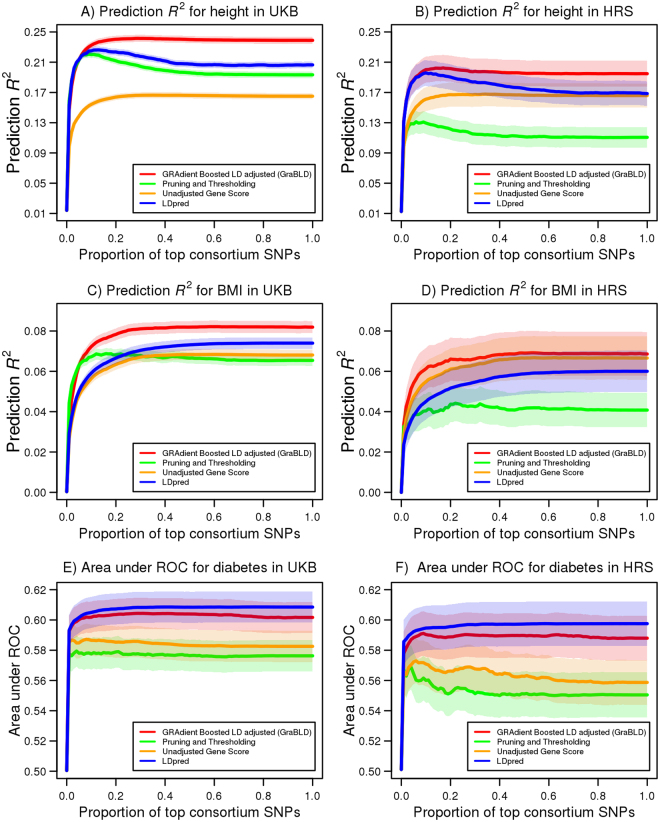
Figure 2.
Prediction R 2 using polygenic risk scores as a function of increasing proportion of SNPs for height, BMI, and diabetes. The prediction R 2 of polygenic risk scores, as a proportion of the top SNPs from the GIANT consortium for height (A) and BMI (C) in the UKB validation set (N = 130,215), with 95% confidence bands. A total of 1.98 M SNPs were considered and ordered from the most to the least significant, according to GIANT summary association statistics. LPpred requires a determination of the fraction of causal SNPs, and illustrates only the best scores by setting the causal fractions to 0.3 and 0.01 for height and BMI, respectively. The prediction R 2 of the UKB polygenic risk scores in HRS is similarly illustrated for (B) height (N = 8,291) and (D) BMI (N = 8,269). The UKB polygenic risk scores were tested in HRS without additional fitting or adjustment. The area under the curve is illustrated for diabetes as a function of the proportion of top SNPs from the DIAGRAM consortium in the UKB validation set (E) and HRS (F) with 95% confidence bands. The LDpred causal fraction of 0.003 was determined in the UKB calibration set for diabetes.

