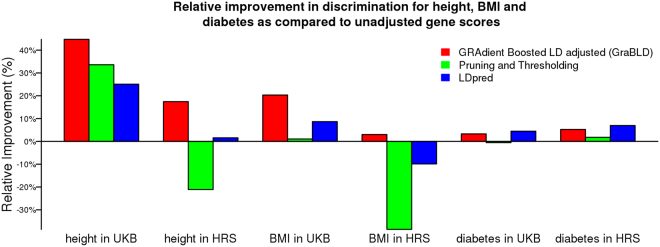
Figure 3.
Relative improvement in discrimination for height, BMI, and diabetes, compared to unadjusted polygenic risk scores. The relative improvement in the prediction R 2 of gene scores, compared to the unadjusted polygenic risk score, is illustrated for height and BMI in the UKB validation set and HRS. For diabetes, the relative improvement in the area under the curve (AUC) is illustrated. For all traits, the polygenic risk score weights were derived from the UKB calibration set and tested without additional fitting or adjustment.

