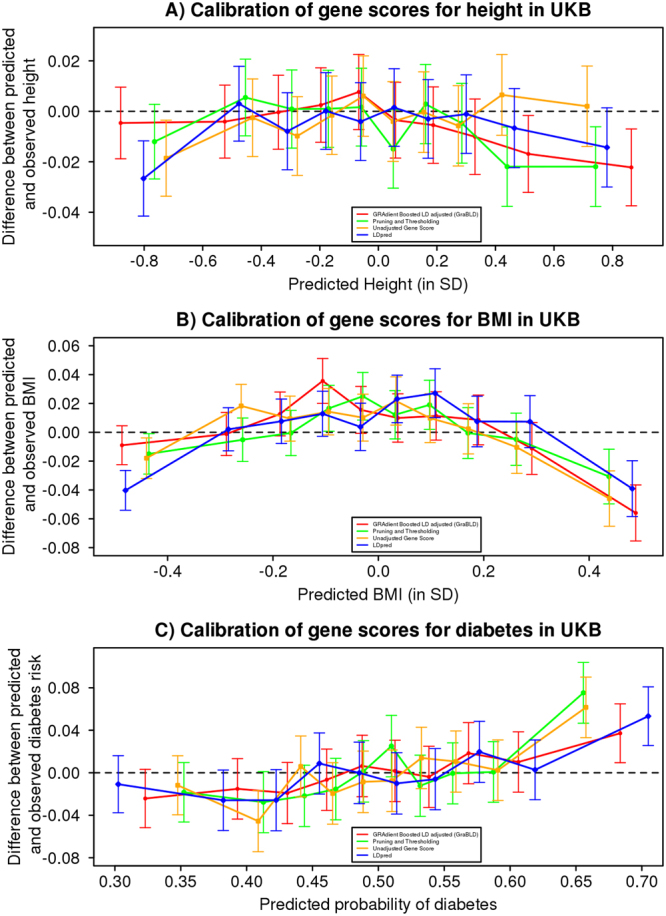
Figure 4.

Calibration of height, BMI, and diabetes polygenic risk scores. For each trait and method, the polygenic risk score values for the UKB validation set were divided into deciles. For each decile, the difference between the mean observed and predicted trait (95% confidence interval) is illustrated as a function of the mean predicted trait for that decile. The trait is expressed per SD unit for height (A) and BMI (B). A similar analysis was performed for diabetes, whereby the difference between the observed probability of diabetes and the predicted probability is illustrated as a function of the predicted probability for each decile.
