Figure 4.
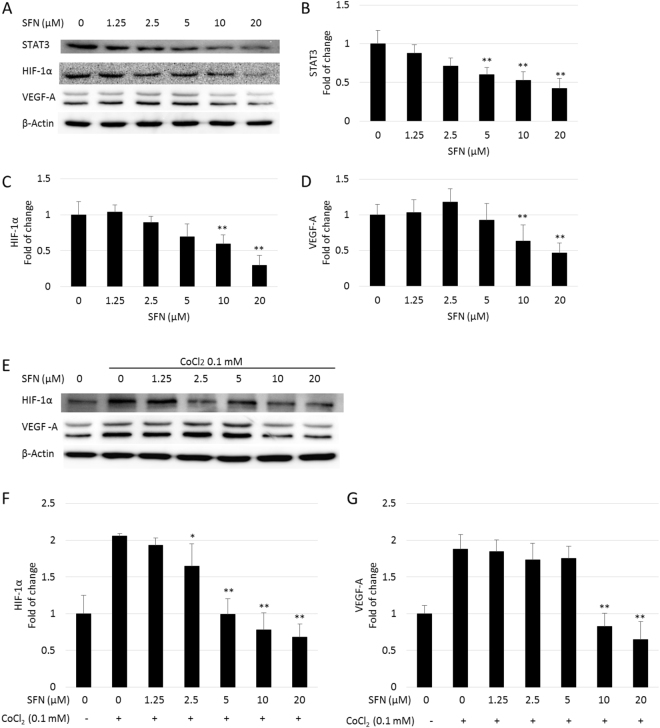
Dose response of SFN on protein expression in HepG2 cells. Cells were treated with 0–20 µM SFN without (A) or with 0.1 mM CoCl2 (E) for 24 hours, whole cell lysates were collected as described and subjected to Western blotting for STAT3, HIF-1α and VEGF-A. β-actin was used as a loading control. Band densities were normalized against β-actin, and results were expressed as fold induction relative to controls (B–D,F and G). Data are expressed as means ± SD (n = 3). *p < 0.05, **p < 0.01 compared to control.

