Figure 3.
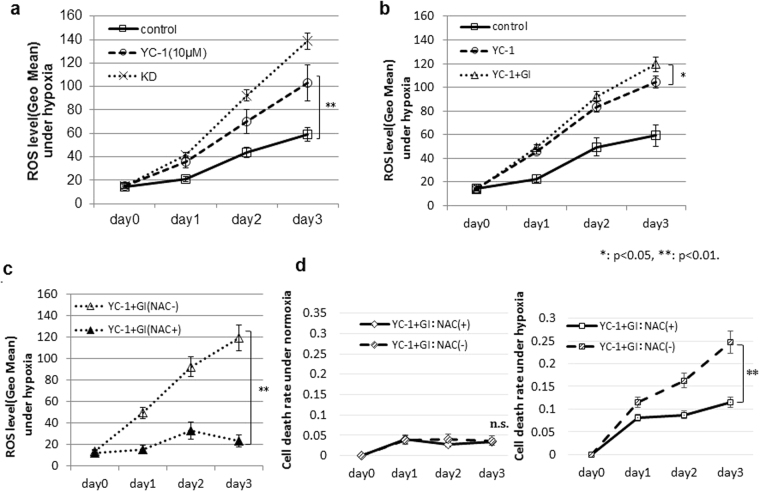
Effect of YC-1 + GI on ROS generation under hypoxia. (a) ROS levels in 58As9 cells with or without 10 μM YC-1 and in KD cells were analyzed under hypoxia for 3 d. (b) ROS levels in YC-1- or YC-1 + GI-treated cells under hypoxia. (c) ROS levels in YC-1 + GI-treated cells with or without 5 μM NAC. (d) Cell death rate in YC-1 + GI-treated cells with or without NAC under normoxia and hypoxia. ns: not significant, *p < 0.05, **p < 0.01.

