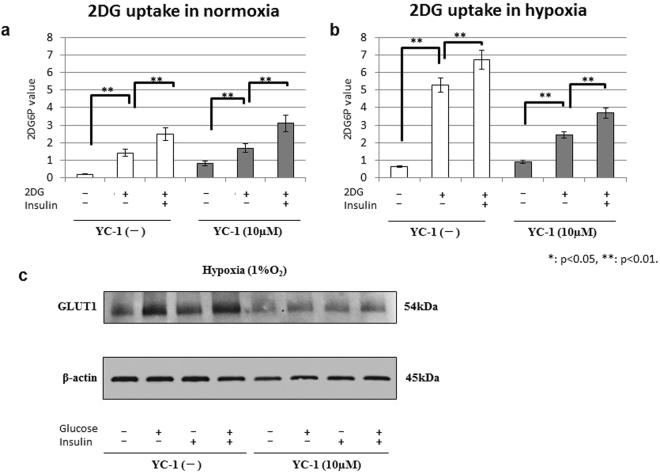
Figure 5.
Glucose uptake in 58As9 cells with or without YC-1 + GI. (a,b) 2DG uptake levels in control and YC-1-treated cells were analyzed under normoxia (a) and hypoxia (b) for 24 h in the presence or absence of insulin. (c) Western blot analysis of membranous GLUT1 (54 kDa) levels in control and YC-1-treated cells that were cultured under hypoxia for 24 h in the presence or absence of G and/or I. β-actin was equally expressed in all cells. ns: not significant, **p < 0.01.

