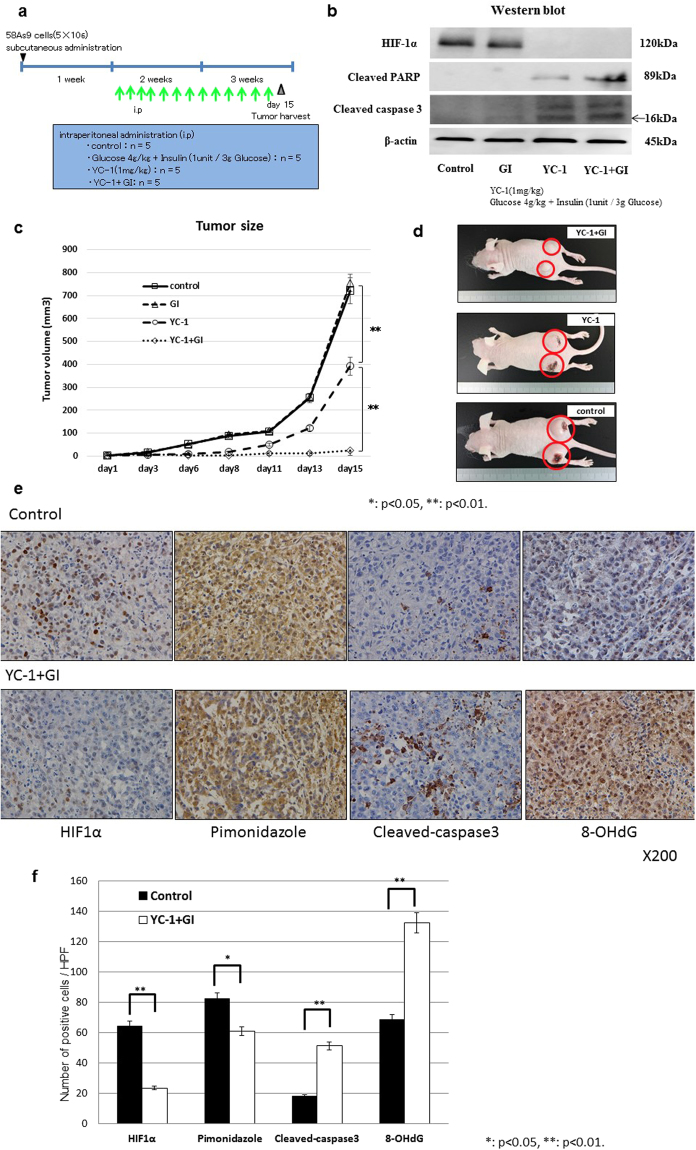
Figure 7.
In vivo effect of YC-1 + GI treatment on tumour xenografts. (a) Experimental schedule of the YC-1 + GI treatment. The day 58As9 cells were subcutaneously injected is indicated by a triangle. The daily ip injections are shown by green arrows. Tumours were harvested on day 15, which is indicated by a reticulated triangle. Doses of drug treatments including control, glucose, YC-1 and YC-1 + GI are shown in the blue square. (b) Western blot analysis of HIF-1α, cleaved-caspase3 and cleaved-PARP in tumour xenografts from control, GI, YC-1 and YC-1 + GI groups. (c) Tumours sizes in the control, GI, YC-1 and YC-1 + GI groups were estimated on the indicated days. Mean value ± SE of tumor volumes was calculated and plotted on the graph. (d) Pictures of tumours treated with YC-1 + GI, YC-1 or control. (e) Immunohistochemical analysis of HIF-1α, pimonidazole, cleaved-caspase3 and 8-OHdG expressions in xenograft tumours from control or YC-1 + GI mice. (f) Comparison of the number of positively-stained cells from HIF-1α, pimonidazole, cleaved-caspase3 and 8-OHdG immunohistochemistry between control and YC-1 + GI treatment. ns: not significant, *p < 0.05, **p < 0.01.

