
Figure 1.
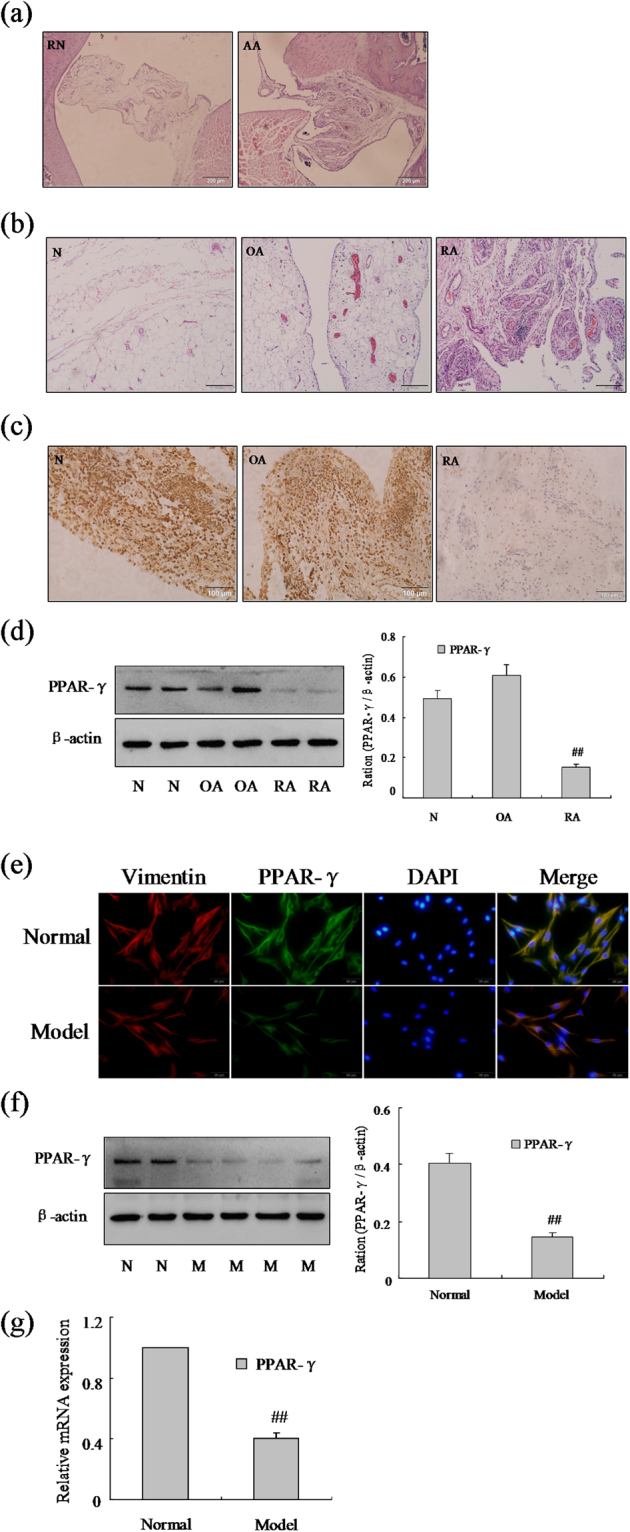
The expression of PPAR-γ was down-regulated in RA FLSs. (a) Representative H&E staining of AA and normal synovial tissues in rat (original magnification, ×10). (b) Representative H&E staining of RA, OA and normal synovial tissues in human (original magnification, ×10). (c) The expression of PPAR-γ in RA, OA and normal synovial tissue was analyzed by IHC staining analysis in human. (d) The protein level of PPAR-γ was analyzed by Western blot in RA, OA and normal synovial tissue. (e) The expression of PPAR-γ and Vimentin were analyzed by double immunofluorescence staining analysis in rat AA and normal FLSs. (f) The protein level of PPAR-γ was analyzed by Western blot in AA and normal FLSs. (g) The mRNA level of PPAR-γ was analyzed by Q-PCR in AA and normal FLSs. All values were expressed as mean ± SEM. ##P < 0.01 vs normal group.