
Figure 2.
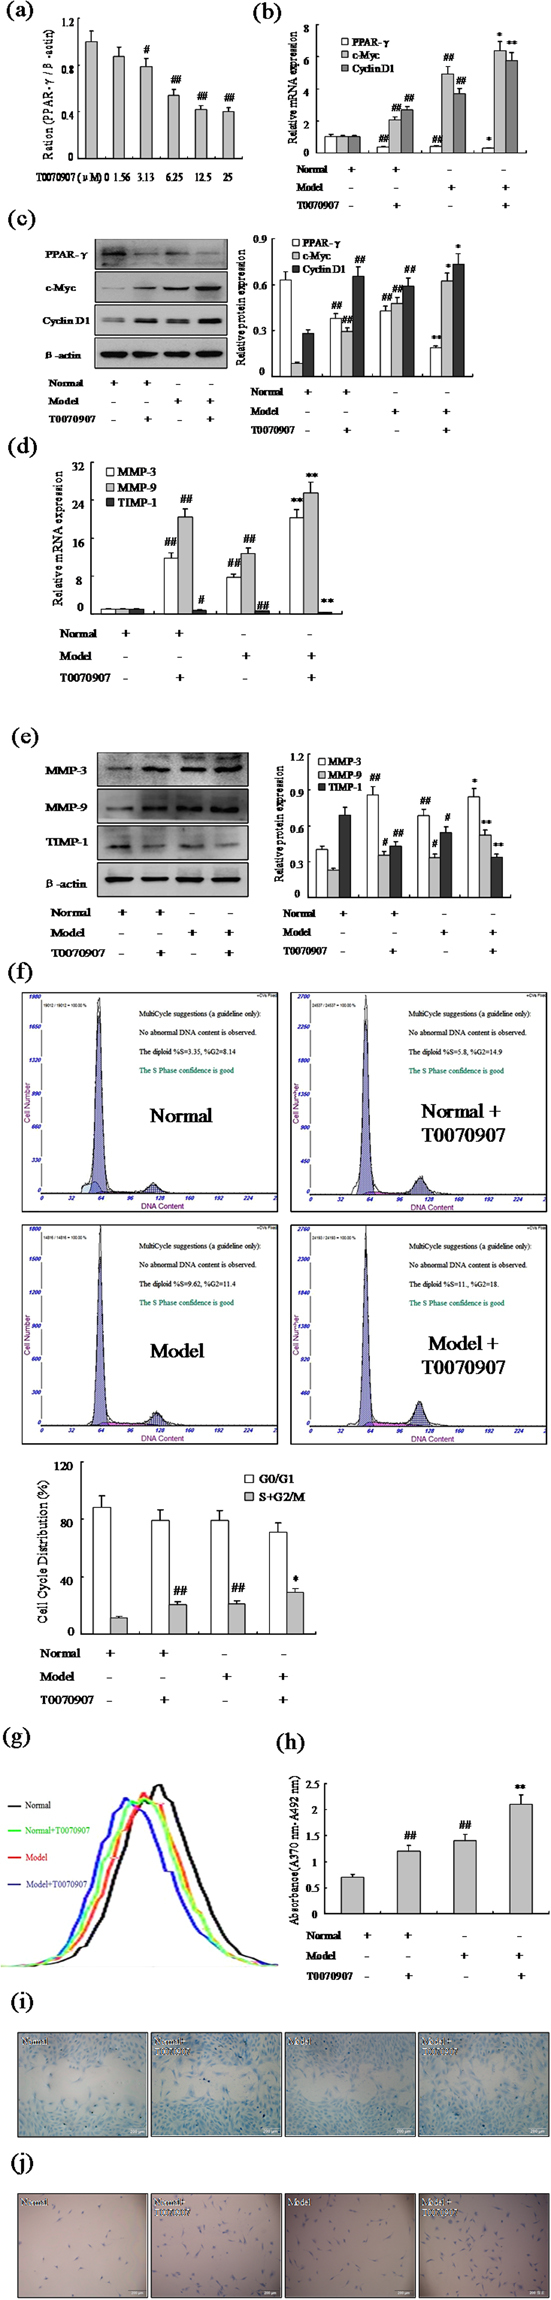
Effect of PPAR-γ inhibitor increases FLSs proliferation and migration. (a) Concentration-dependent inhibition expression of PPAR-γ mRNA by T0070907 in normal FLSs, tested by Q-PCR assays. (b) The mRNA levels of PPAR-γ, c-Myc and Cyclin D1 were analyzed by Q-PCR in FLSs with T0070907 (12.5 μM). (c) The protein levels of PPAR-γ, c-Myc and Cyclin D1 were analyzed by Western blot in FLSs with T0070907 (12.5 μM). (d) The mRNA levels of MMP-3, MMP-9 and TIMP-1 were analyzed by Q-PCR in FLSs with T0070907 (12.5 μM). (e) The protein levels of MMP-3, MMP-9 and TIMP-1 were analyzed by Western blot in FLSs with T0070907 (12.5 μM). (f) Cell cycle of FLSs were incubated with T0070907 (12.5 μM) for 48 h and then subjected to the FACS analysis. (g) After stained with CFDA-SE, FLSs were incubated with T0070907 (12.5 μM) for six days and then subjected to the FACS analysis. (h) BrdU proliferation assay were treated with T0070907 (12.5 μM) 48 h in FLSs. (i) FLSs were treated with T0070907 (12.5 μM), and migration into the wound-healing 24 h was photographed (original magnification, ×10). (j) FLSs were treated with T0070907 (12.5 μM), and transwell migration 48 h was photographed (original magnification, ×10). All values were expressed as mean ± SEM. #P < 0.05, ##P < 0.01 vs normal group. *P < 0.05, **P < 0.01 vs model group.