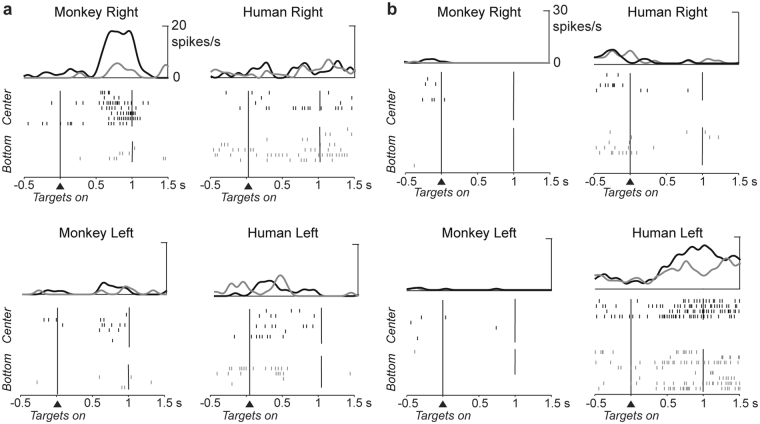
Figure 4.
Spike raster plot of a monkey-only cell and a human-only cell. (a) Monkey-only cell. Cell showing a preference for the center right target position in monkey trials during the delay period. The same cell is not selective for the target position in the human trials. (b) Human-only cell. Cell with a preference for center and bottom left target positions in the human trials. This cell shows very low activity in the monkey-only trials, with no spatial selectivity. Each segment in the raster plot indicates the cell discharge relative to the targets onset with spike density averages above each raster.

